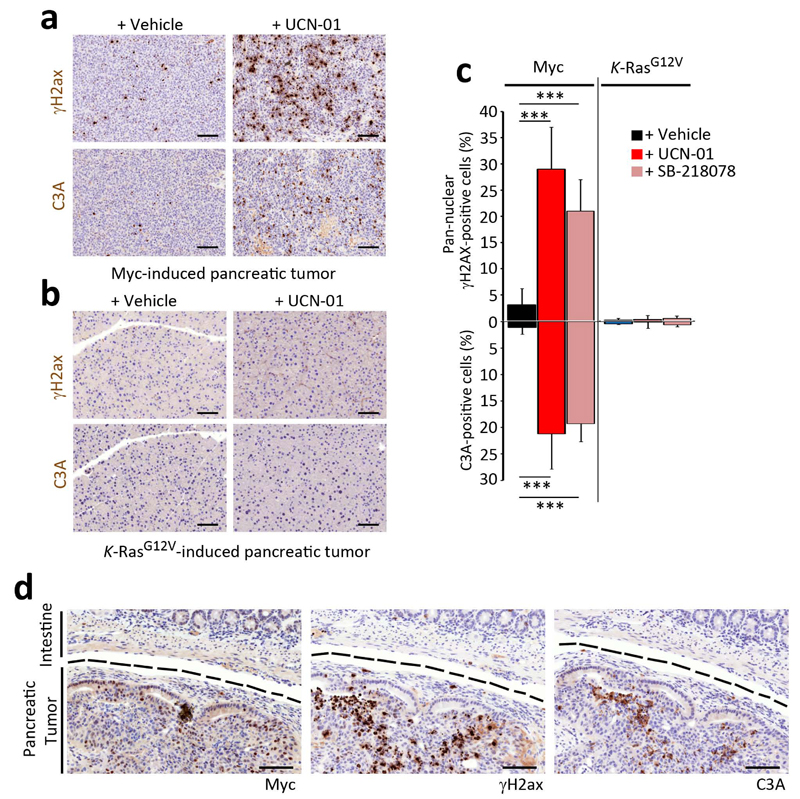
Fig. 5.
Effect of Chk1 inhibitors in Myc- or Ras-driven pancreatic tumors. Representative images of γH2ax and activated caspase-3 (C3A) IHC done on pancreatic tumors obtained from (a) Ela-myc or (b) K-RasG12V-knockin mice, after 3 days of treatment with UCN-01 (i.p. 5 mg per kg). Black scale bars indicate 100 μm. (c) Quantification from the analysis presented in (a,b). (d) γH2ax, C3A and c-Myc IHC on the pancreatic tumor from an Ela-myc mouse after a 3 day treatment with UCN-01 (i.p. 5 mg per kg). A dashed black line separates the tumoral area from the neighbouring intestine. Black scale bars indicate 100 μm.

