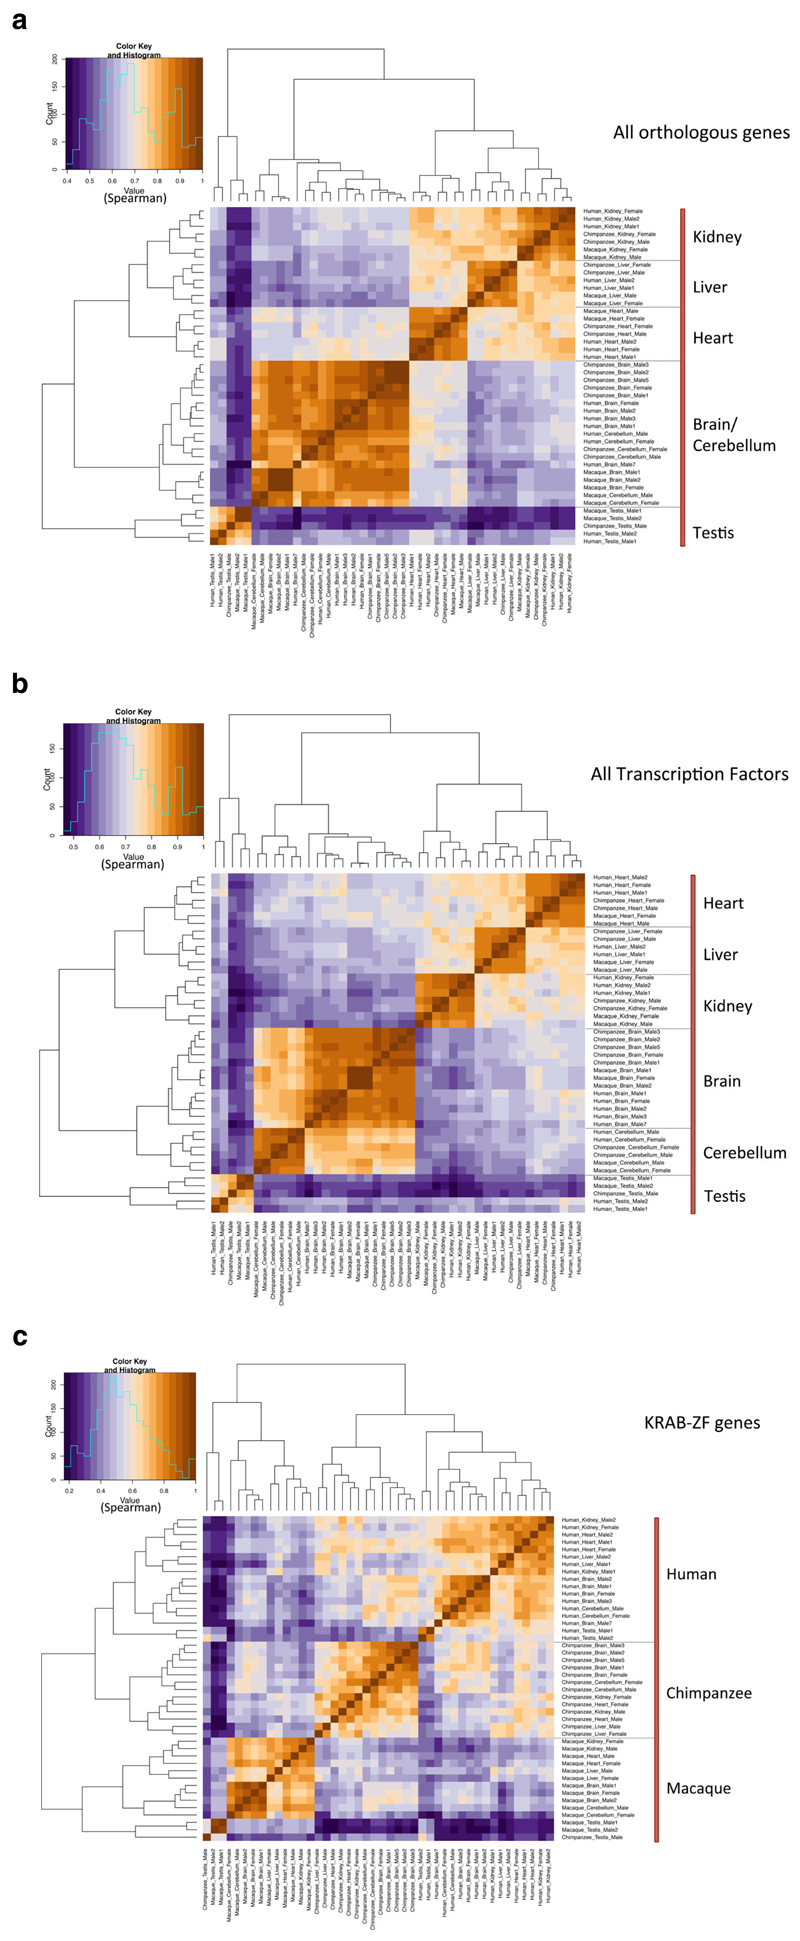
Figure 1. Correlations of mRNA levels for human, chimpanzee, and rhesus macaque orthologous genes.
Spearman correlation heatmaps and hierarchical clustering for (a) all orthologous genes, (b) all transcription factors orthologous genes (except ZFs), and (c) KRAB-ZF only. The highest Spearman correlation coefficients correspond to brown colors. (a) Expression of all orthologous genes and (b) expression of all human transcription factors cluster according to tissue, with a high Spearman correlation coefficient. (c) Expression of KRAB-ZF genes clusters according to species, with a high Spearman correlation coefficient.

