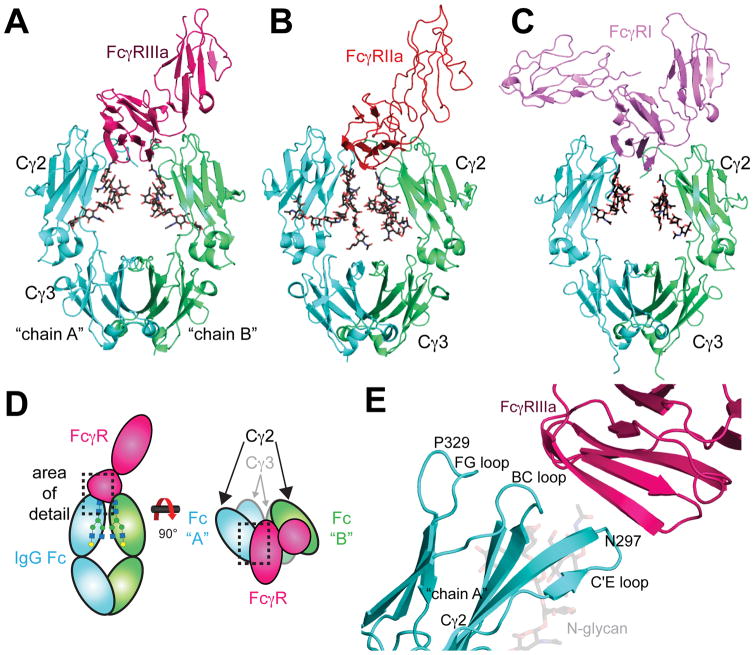
Figure 2.
A) Structural model of the Fc-FcγRIIIa interaction (PDB 3AY4) the (B) Fc-FcγRIIa interaction (PDB 3RY6) and (C) the Fc:FcγRI interaction (PDB 4X4M). Fc N-glycans are shown as black stick models. D) Schematic diagram of the Fc:FcγR interaction. E) Fc Cγ2 loops serve as the FcγRIIIa (pink) binding site. The C’E loop includes N297, the site of N-glycosylation. The Fc chain A monomer (cyan) shown to emphasize the locations of the loops structures (PDB 1E4K). The interaction between chain A and FcγRIIIa occurs primarily at the site of these Fc Cγ2 loops.

