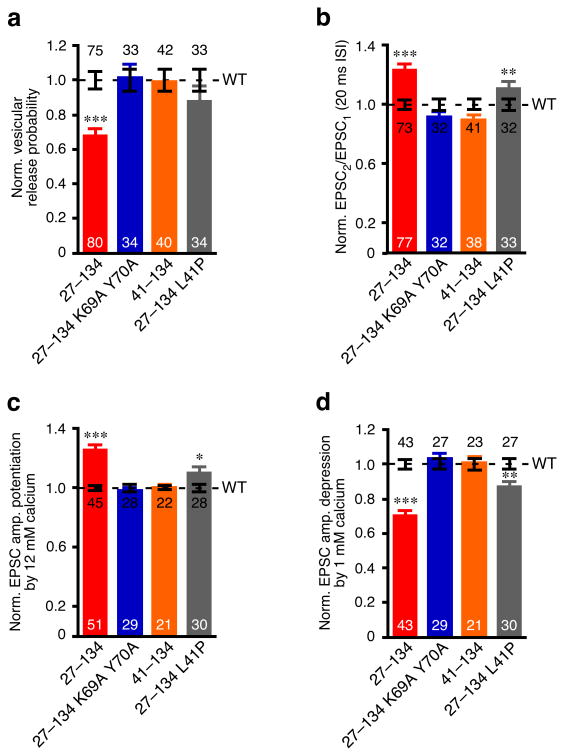
Figure 6. Overexpression of CplxI N-terminal mutants in WT neurons.
Summary data of WT neurons overexpressing CplxI WT-IRES-EGFP (control) or CplxI mutant-IRES-EGFP. Data were normalized to the mean values of the respective controls (dotted line). Bar graphs show Pvr (a), paired-pulse ratio (b), and (c-d) EPSC amplitude potentiation (c) or depression (d) by elevating or lowering Ca2+ concentration, respectively. Data are expressed as mean ± SEM. Analyzed neuron numbers are indicated on the bars; * indicates p < 0.05, ** indicates p < 0.01, *** indicates p < 0.0001 as compared to overexpression of CplxI WT.

