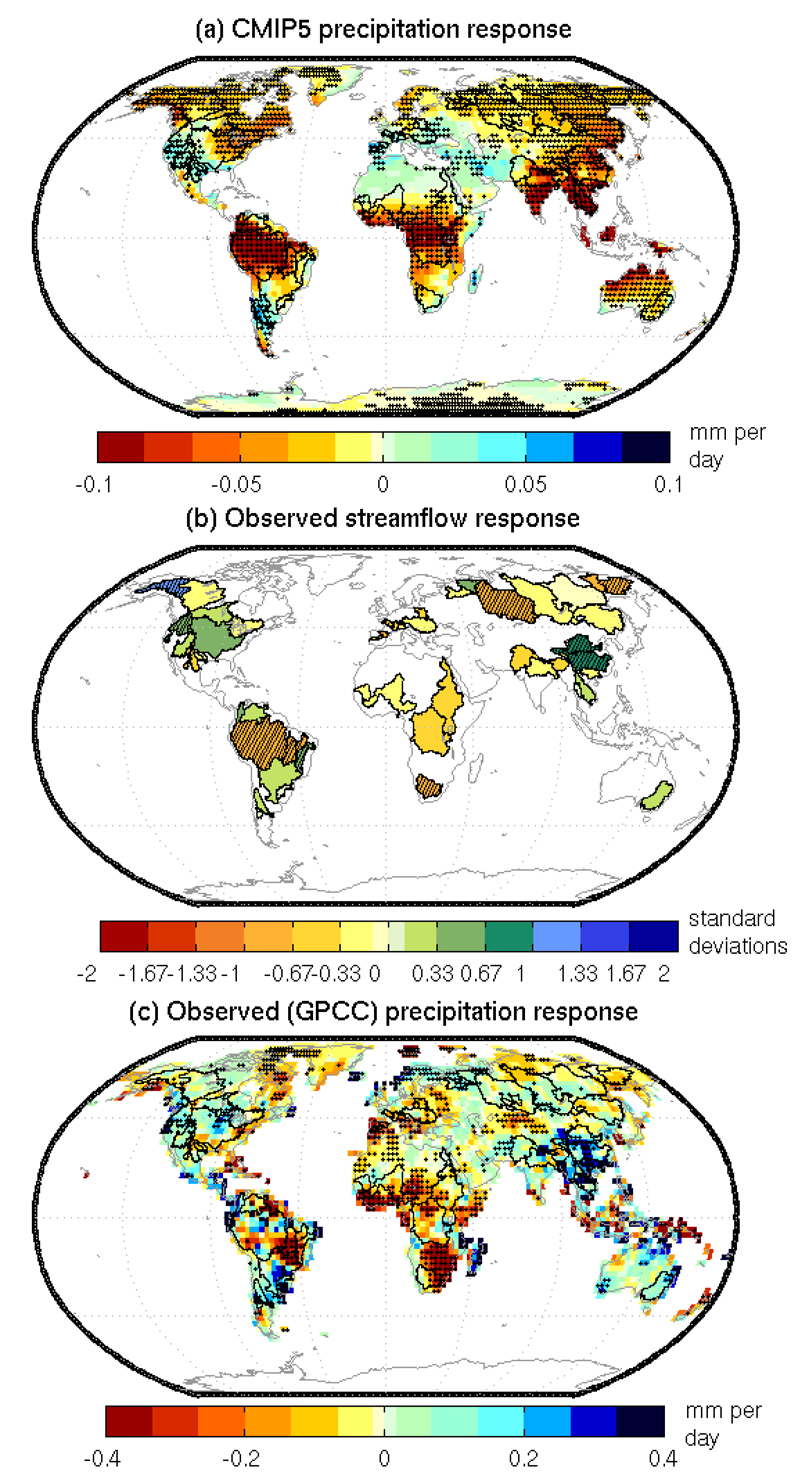
Figure 1. Precipitation and streamflow response to eruptions.
a) CMIP5 multi model mean precipitation response averaged across 6 eruptions for the 2 years following eruptions. River basins examined are overlaid. Stippled grid points show a statistically significant response at the (2-sided) 20% level. b) Observed streamflow response averaged across multiple eruptions (see Table S3) [standard deviation units], hatching indicates significance at the 80% level. c) as a) but observed (GPCC) precipitation averaged across 5 eruptions, colour scale different from a). For b) ENSO is removed for rivers with which it correlates significantly (p=0.1), and from all grid cells in c).

