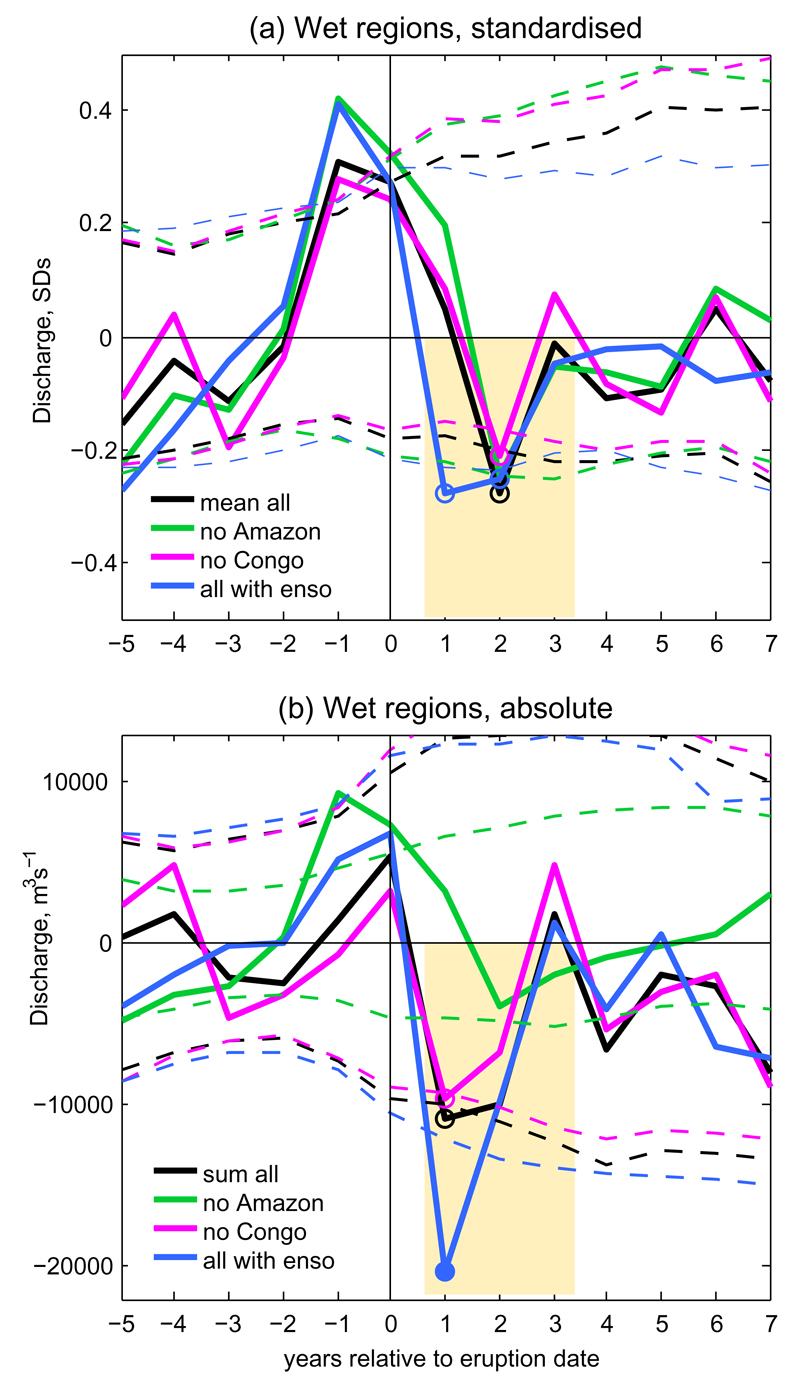
Figure 3. Observed response of rivers across wet tropical-subtropical regions.
(a) Regional average of standardised response to eruptions as in Figure 2 [std deviations]. (b) as (a) but based on the sum of the flow in individual rivers using absolute values [m3/s]. (See Supplementary Fig. S4 for the 10 rivers used). Solid black indicates results from all 10 rivers, green all rivers excluding the Amazon, pink excluding the Congo, and blue without removing influence of ENSO. Dashed lines and circles indicate significance as in Figure 2, with colours matching the corresponding regional mean.

