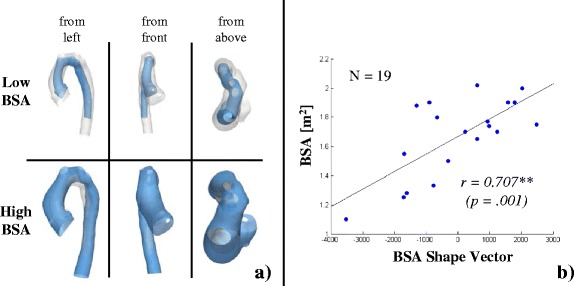
Fig. 10.

Visualisation of the BSA shape mode (a) and correlation with BSA shape vector (b). Shape features associated with deforming the template along the BSA Shape Mode from low (a, top) to high BSA values (a, bottom) from different views as indicated. Low BSA values were associated with a slim, straight and rounded arch shape, whereas moving towards higher BSA values resulted in an overall size increase along with shape deformation towards a more tortuous gothic arch with a slightly dilated root. The measured BSA of the subjects and the shape features as described by the BSA Shape Mode correlated strongly (b)
