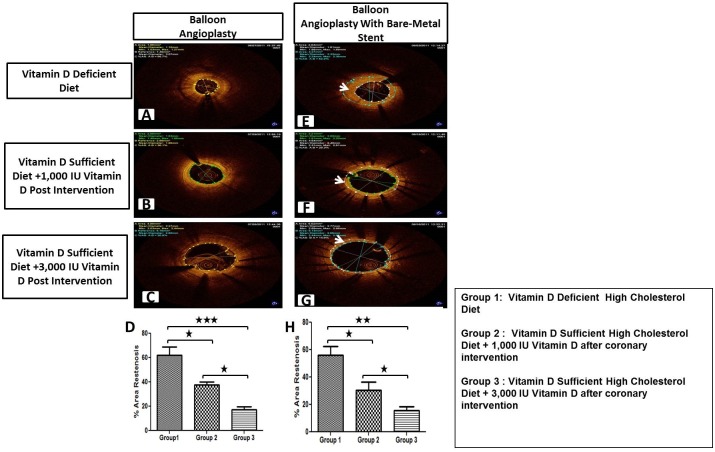
Fig 2. OCT examination of six months post intervention porcine coronary arteries—Representative images.
Coronary arteries at the balloon angioplasty site (A-C) (E-G) and coronary arteries following bare metal stenting (E-G). Quantitative analysis was performed to calculate % area restenosis in post-angioplasty (D) and post-stenting (H) coronary arteries (N = 12). Group 1: Vitamin D-deficient high cholesterol diet; Group 2: Vitamin D-sufficient high cholesterol diet + 1,000 IU/d vitamin D after coronary intervention; Group 3: Vitamin D-sufficient high cholesterol diet + 3,000 IU/d vitamin D after coronary intervention; Data are shown as mean ± SEM (N = 4 in each experimental group); *p< 0.05, **p< 0.01, ***p< 0.001.

