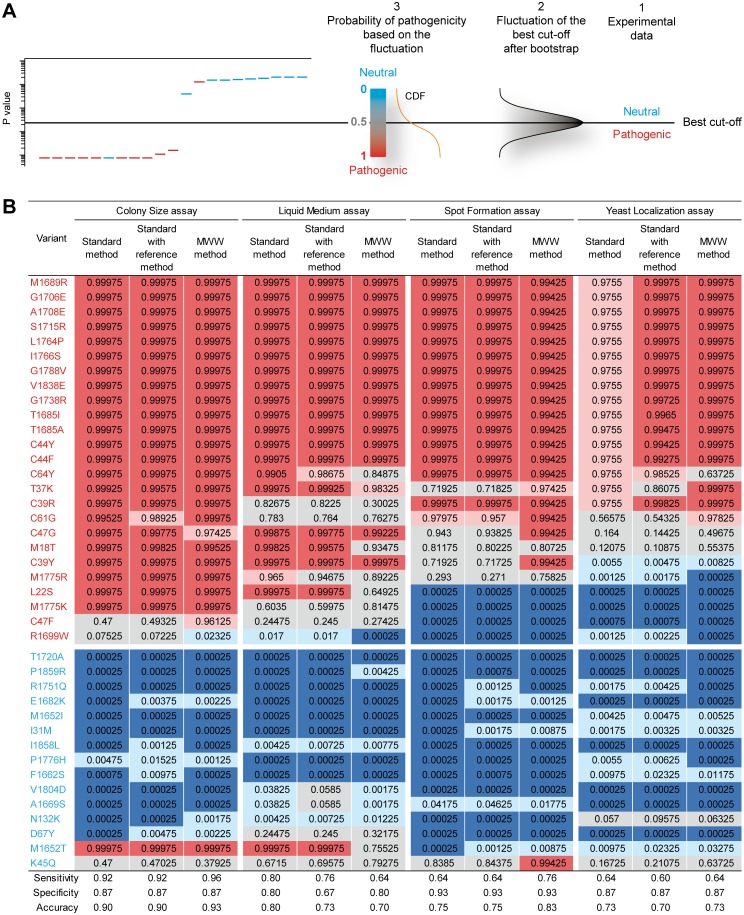
Fig 2. Variant classification using the probability system.
(A) Schematic of the probability system of classification. The left figure depicts a theoretical waterfall distribution of pathogenic and neutral missense mutations, as in Fig 1B. Horizontal black line, experimental best cut-off. (1) Variant classification according to the experimental best cut-off (method used in Table 1). (2) Distribution of the best cut-off generated by bootstrap analysis from the experimental data. (3) Cumulative distribution function (CDF) derived from the distribution of the best cut-off. This CDF provides a probabilistic classification of the variants, depending on their positions in the CDF. (B) Classification of the BRCA1 variants assessed in four functional assays. Colored background in the table indicates the five-class nomenclature, as in S1 Table. Names in red and blue indicate the pathogenic and neutral mutations, respectively, according to their prior classification. The sensitivity, specificity and accuracy computation are detailed in S6 Table.

