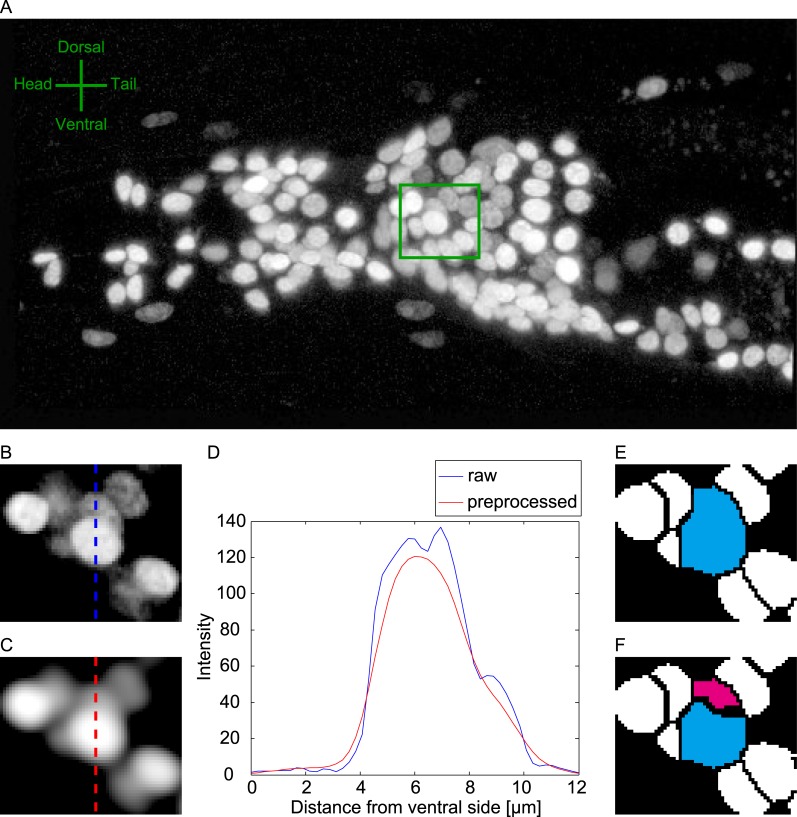
Fig 1. Overlooking of nuclei by conventional blob detection.
(A) Example of 3D image of neuronal nuclei in the head region of a worm (Data 1, see Methods). Image is displayed as max projection along x3 axis. Note that all of the raw images in this paper is displayed in logarithmic scale in order to visualize dark nuclei. (B) Enlarged view of green box in (A). A particular slice along the x3 axis is displayed. (C) Preprocessed image of the image in (B). (D) Intensities on the dotted lines in (B) and (C). (E) Results of watershed segmentation (step 2 of the proposed method). The region of the brighter nucleus is shown in cyan. (F) Results of segmentation by the proposed method (step 3 of the proposed method). The region of the darker nucleus is shown in magenta.

