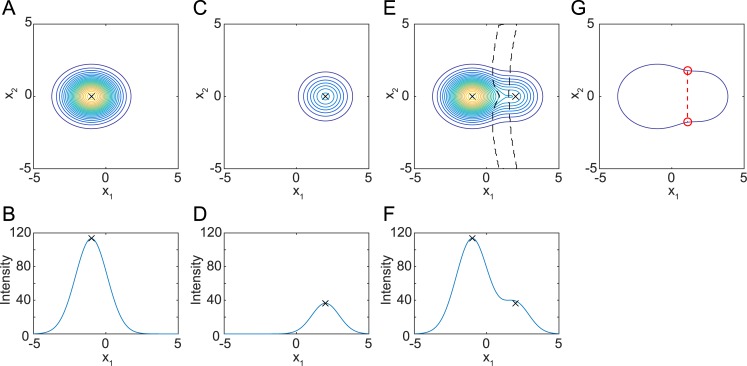
Fig 2. Fluorescence intensity distribution of nuclei approximated by Gaussian distribution.
(A, B) Example of fluorescence intensity distribution of a bright nucleus approximated by Gaussian distribution f1. π1 = 120, μ1 = (−1,0,0), Σ1 = (diag(1.10,0.89,1.35))2. (C, D) Example of fluorescence intensity distribution of a dark nucleus approximated by Gaussian distribution f2. π2 = 40, μ2 = (2,0,0), Σ2 = (diag(1.10,0.89,1.35) × 0.9)2. (E, F) Fluorescence intensity distribution when a dark nucleus is near a bright nucleus, approximated by a mixture of distributions f1 and f2. Area enclosed by black broken lines in E displays an area of negative curvature. (A, C, E) Iso-intensity contour lines of trivariate Gaussian distribution at x3 = 1. (B, D, F) Plot of intensity at (x2,x3) = (0,1). Black crosses indicate peak positions. (G) Outline of the fused blob and typical result of 2D clump splitting method. Red points indicate concave points. Red dashed line indicates the border line.

