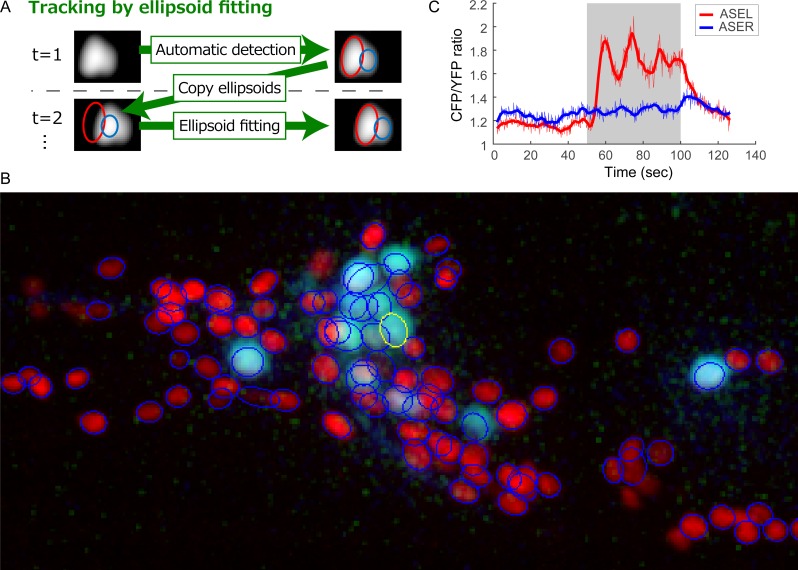
Fig 6. Methods and results of tracking using RoiEdit3D.
(A) Schematic illustration of the tracking method. (B) Part of the data used for tracking (Data 2). Three-dimensional image of the first time point is shown as the max projected image of the right half of the animal. Neuronal nucleus marker is shown in red, and calcium indicator is shown in light blue. ROI of ASER is shown as a yellow ellipse. Other ROIs appear as blue ellipses. (C) Time course of ASER response obtained by the calcium indicator. Gray area indicates the stimulation period.

