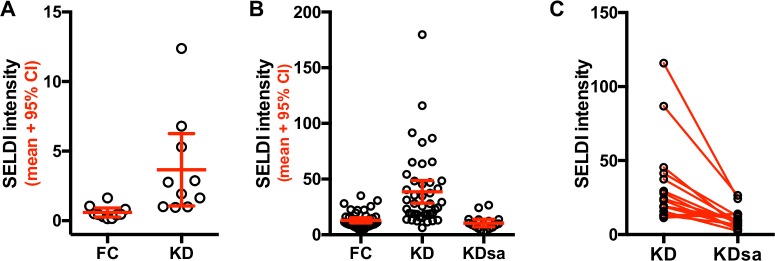
Fig 1. SELDI peak intensities for Fx1 CM10 7,860 Da peak in Cohort 1.
A) Means and 95% confidence interval (CI) for 10 KD and 10 FC subjects in the Discovery cohort are shown. B) Mean and 95% CI for 43 KD, 42 FC and 17 KDsa from the Confirmation cohort are shown. C) SELDI intensities for the 7,860 Da peak of 17 KD subjects during their acute and subacute phases of illness, from the Confirmation cohort. The acute and subacute values for 17 KD subjects are connected with a line.

