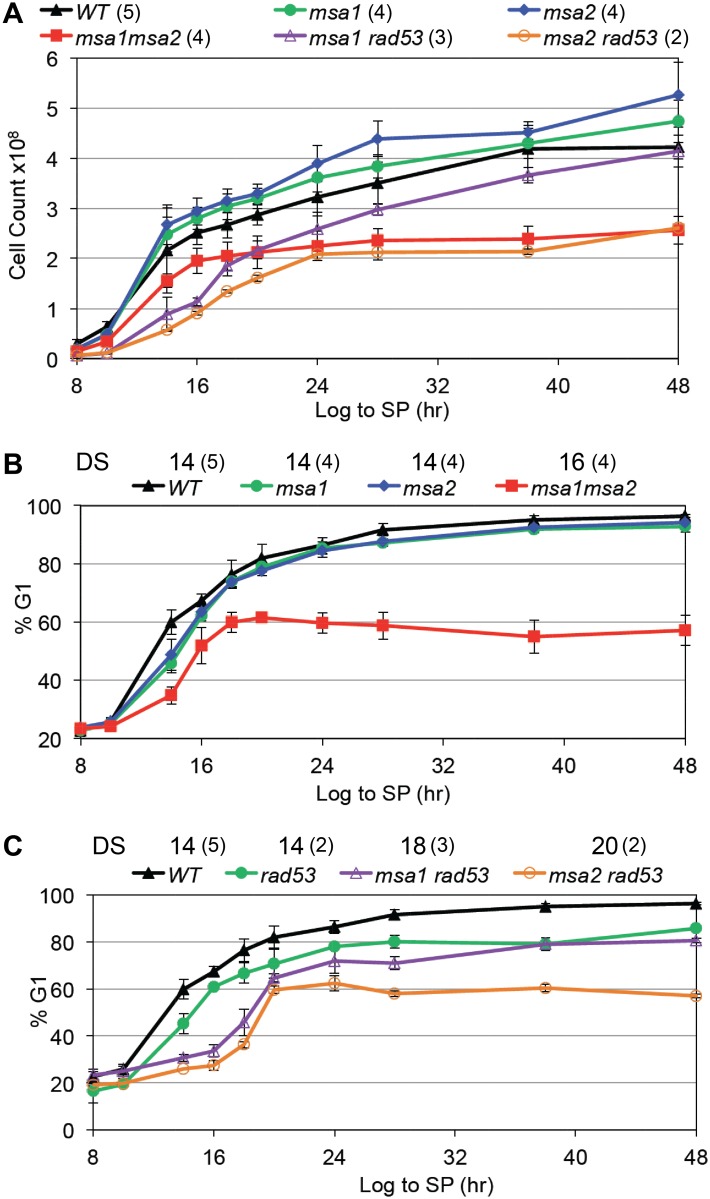
Fig 3. Msa1, Msa2 and the checkpoint function of Rad53 all contribute to the control of proliferation and the G1 arrest that accompanies growth to stationary phase.
Cell number (A) and percent of cells in G1 (B and C) are plotted as cells grow from log phase to stationary phase as in Fig 2. The hour after which the diauxic shift (DS) has occurred for each strain is noted above. Genotypes as indicated. Number of trials averaged for these figures is shown in parentheses.

