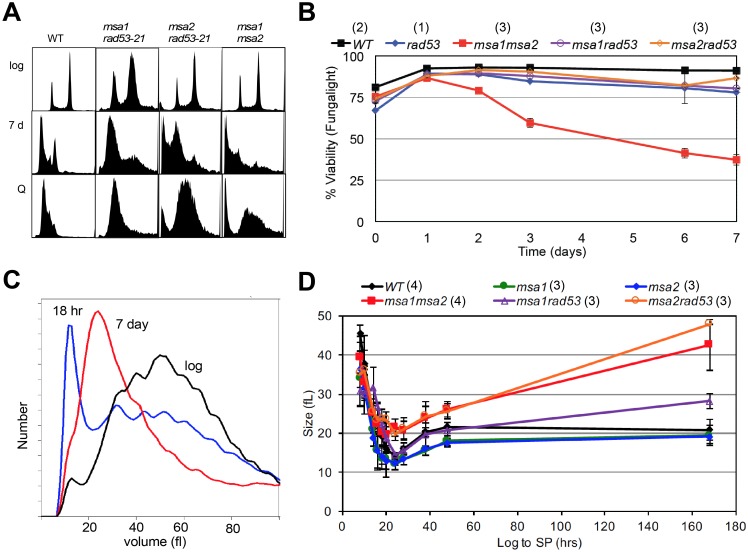
Fig 4. Msa1 and Msa2 and the checkpoint function of Rad53 contribute to the control of cell expansion and survival.
(A) Flow cytometry histograms of DNA content of cells during logarithmic growth (log), after seven days of growth to saturation (7d) and from purified quiescent cells (Q). Genotypes as indicated. The two prominent peaks in log phase wild type (WT) cells reflect the 1N and 2N DNA content of cells in G1 and G2/M, respectively. The trough between the peaks reflect cells in S phase. Note that over 90% of WT cells are in G1 after seven days, and the DNA of the cells that purify as Q cells shifts to a sub-1N position. This shift is due, at least in part, to their resistance to dye penetration [41]. Most of the msa1msa2 cells contain very low and heterogeneous DNA content after seven days (7 d) of growth. This is correlated with loss of viability. (B) Plots of viability over a seven day time course of growth in rich medium for the genotypes indicated. (C) Representative Coulter Counter trace of cell volume distributions of wild type (BY6500) cells in log phase compared to that of cells six hours after the diauxic shift (18 hours), and after seven days of growth. (D) Plot of modal cell volume of the genotypes indicated as they undergo asymmetric cell divisions and enter stationary phase over a seven day time course. Number of trials averaged for these figures is shown in parentheses.

