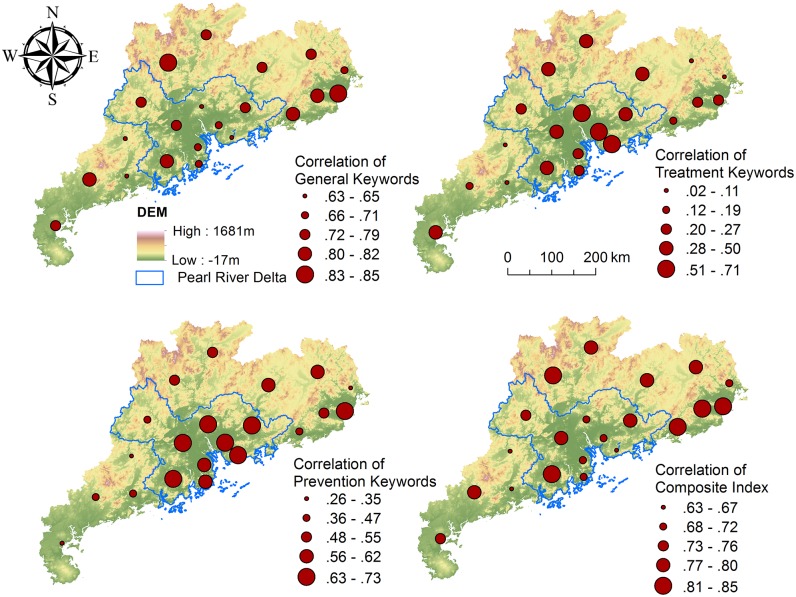
Fig 3. Correlations between HFMD cases and search volumes across the province from 2009 to 2011.
The map on the top left shows the spatial distribution of the Pearson correlation coefficient for the HFMD cases and general keywords from 2009 to 2011 for all of the cities. The same indicators were measured for treatment keywords (top right), prevention keywords (bottom left), and composite indexes (bottom right). Maps were created in ArcGIS 10.2 (Environmental Systems Resource Institute, ArcMap Release 10.2, ESRI, Redlands, California).

