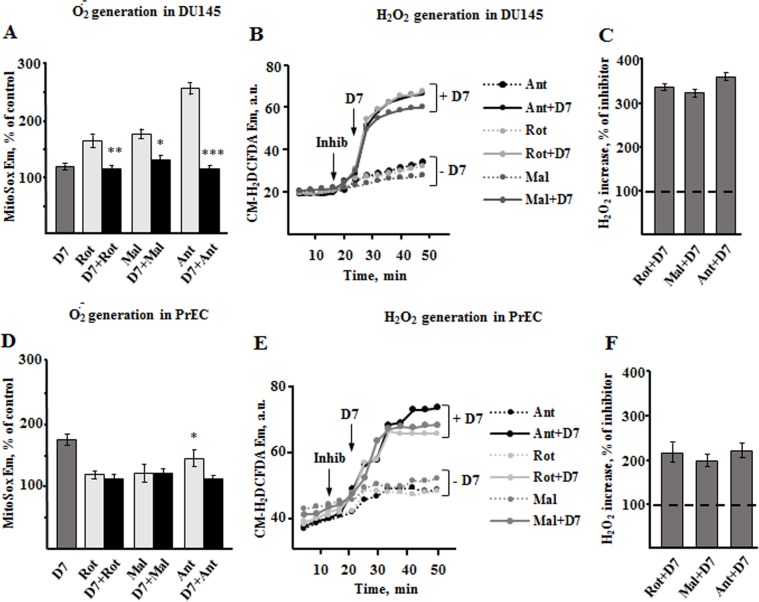
Fig 5. Non-thermal plasma induces oxidative stress in prostate cancer and normal cells.
Flow cytometry measurements were performed in the presence of inhibitors of mitochondria respiratory complexes I (1μg/ml rotenone, Rot), II (500 μM malonate, Mal) and III/IV (2.5 μM antimycin, Ant). The inhibitors were used in combination with plasma treated PBS (D7) and dynamic changes of fluorescent probes’ emission was measured for 50 minutes. (A,D) Quantitative data of changes of MitoSox signal under modulation of cells with inhibitors and plasma treated PBS. The statistical significance is presented on top of the columns with respect to the plasma induced signal (D7). (B,E) Dynamic changes of CM-H2DCFDA emission upon stimulation of cells with inhibitors and plasma treated PBS. (C,F) Quantitative data of changes of CM-H2DCFDA signal. Data presented as mean±SEM (n = 3).

