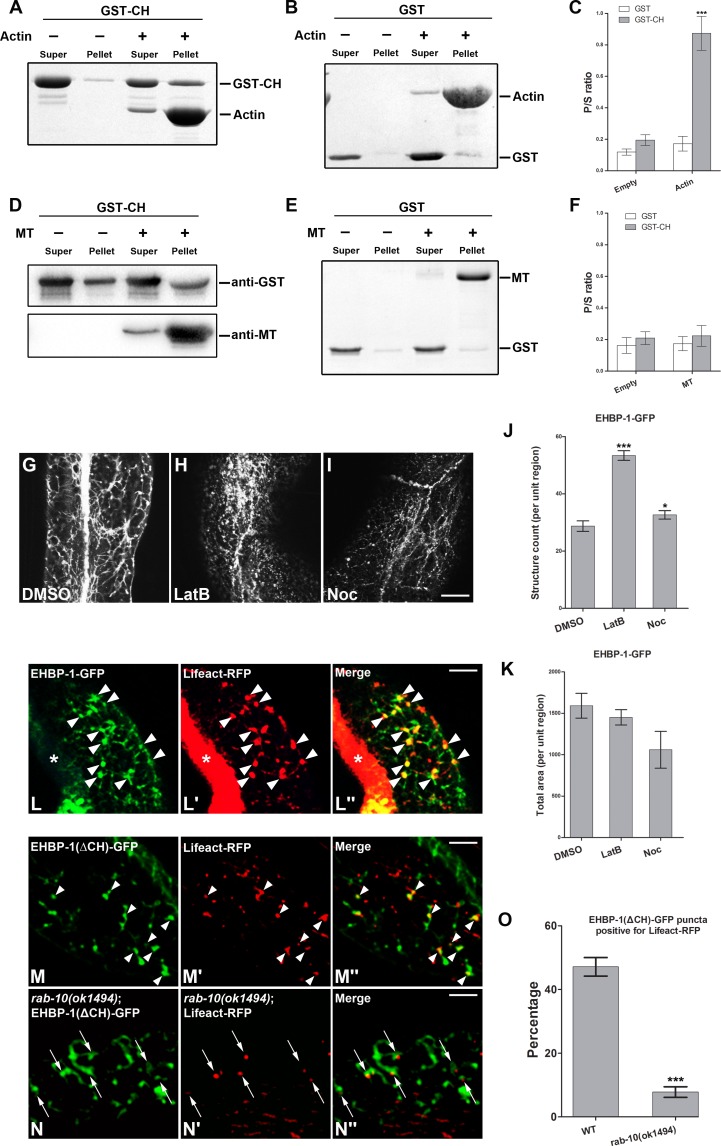
Fig 5. Interaction of the EHBP-1 CH domain with F-actin.
(A-B) The EHBP-1 CH domain co-sediments with actin filaments in vitro. GST-CH sedimentation P/S ratio (pellet/supernatant) shifted from ~16% to ~80% with addition of actin filaments (coomassie blue stained gel). P/S ratio was quantified for GST-CH and GST-only in (C), error bars are SEM (n = 3). Asterisks indicate significant differences in the one-tailed Student’s t-test (*** p< 0.001). (D-E) Compared with the control, microtubule addition did not enhance the sedimentation of GST-CH (anti-GST western blot). P/S ratio was quantified for GST-CH and GST-only in (F), error bars are SEM (n = 3). (G-K) Integrity of EHBP-1 positive tubular endosomes requires intact F-actin and microtubule cytoskeletons. (G) EHBP-1-GFP mainly localized to normal appearing tubular endosomes after injection of control DMSO. (H) The intestinal EHBP-1-GFP positive tubular meshwork was disrupted, and EHBP-1-GFP puncta number increased by about 2-fold, after LatB treatment. (I) Microtubule-depolymerizing drug nocodazole (Noc) treatment did not fully disrupt EHBP-1 labeled tubular network. (J-K) EHBP-1-GFP labeled puncta number (structure count) and total fluorescence area (total area) of these puncta within unit region were quantified respectively. Error bars are SEM (n = 18, 6 animals of each treatment were sampled in three different unit regions of each intestine defined by a 100 x 100 (pixel2) box positioned at random). Asterisks indicate significant differences in the one-tailed Student’s t-test (*p< 0.05, *** p< 0.001). (L-L") Actin marker Lifeact-RFP colocalizes well with EHBP-1-GFP on basolateral punctate endosomes in intestinal cells. (M-N" and O) The overlap between Lifeact-RFP and EHBP-1-GFP requires the CH domain. EHBP-1(ΔNT-C2)-GFP colocalizes with actin marker Lifeact-RFP on punctate structures, however, loss of the EHBP-1 CH domain in a rab-10 mutant background resulted in the decrease of EHBP-1-GFP and Lifeact-RFP overlap percentage (from ~47% to ~8%). Percentage of GFP fluorescence area overlapping with Lifeact-RFP was sampled in three different regions of each intestine defined by a 100 x 100 (pixel2) box positioned at random (n = 18 per genotype). Analysis of standard deviations was performed by the student’s T-test. Error bars are SEM. Asterisks indicate significant differences in the one-tailed Student’s t-test (*** p< 0.001). Scale bars represent 10 μm.

