Figure 1.
Figure 1a. Significant associations with plasma C22:0 and subsequent FA
Figure 1a. Red-yellow indicates higher plasma C22:0 associated with lower FA in white matter regions, while cyan-blue indicates higher plasma C22:0 associated with higher FA. Regional statistics are overlaid onto an FA image from a single subject; results are not corrected for multiple comparisons.
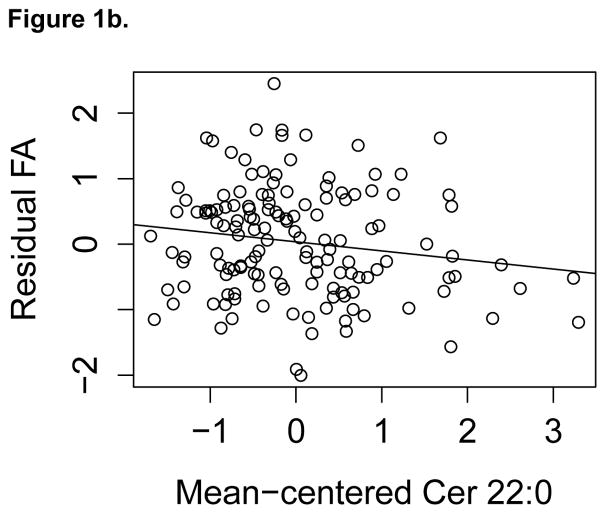
Figure 1b. Anterior Corona Radiata FA by mean-centered Cer 22:0
Figure 1b. Association between FA in ACR and Cer 22:0. The residual FA of ACR was calculated by regressing standardized FA on baseline age, sex, interval between blood draw and DTI, diabetes, BMI, scanner, and ratio of white matter lesions to intracranial volume. This is shown plotted against mean-centered Cer 22:0 with a linear fit overlaid.


