Fig. 2.
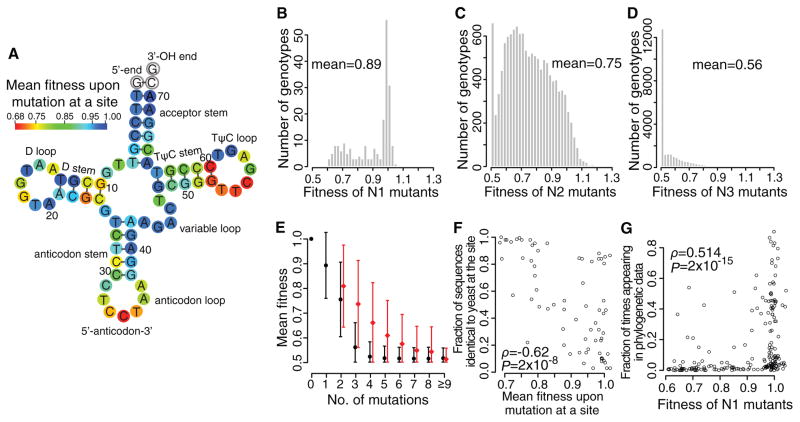
Yeast gene fitness landscape. (A) Average fitness upon a mutation at each site. White circles indicate invariant sites. (B–D) Fitness distributions of (B) N1, (C) N2, and (D) N3 mutants, respectively. (E) Mean observed fitness (black circles) decreases with mutation number. Red circles show mean expected fitness without epistasis (right shifted for viewing). Error bars show one standard deviation. (F) Fraction of the 200 eukaryotic genes with the same nucleotide as yeast at a given site decreases with the average fitness upon mutation at the site in yeast. Each dot represents one of the 69 examined tRNA sites. (G) Fraction of times that a mutant nucleotide appears in the 200 sequences increases with the fitness of the mutant in yeast. Each dot represents a N1 mutant. In (F) and (G), ρ, rank correlation coefficient; P, P-value from t-tests.

