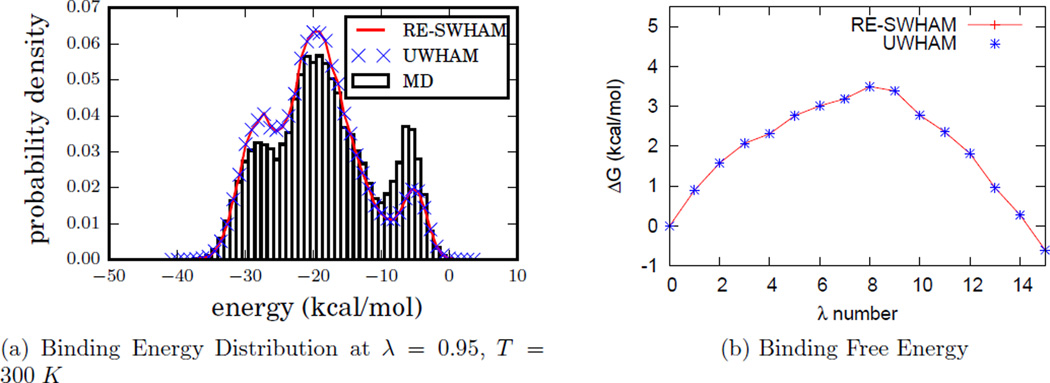
Figure 2.
Numerical comparisons between UWHAM and RE-SWHAM. Plot (a) shows the Heptanoate-β-cyclodextrin binding energy distribution of λ = 0.95 state at 300 K obtained from a 12 ns independent MD simulation, and the UWHAM and RE-SWHAM estimates calculated from 16 independent 12 ns MD simulations run at different λ states. Plot (b) shows the free energy differences between these 16 λ states at 300 K estimated by UWHAM and RE-SWHAM from a 72 ns RE simulation. In both plots the UWHAM and RE-SWHAM results are indistinguishable.

