
Fig. 1.
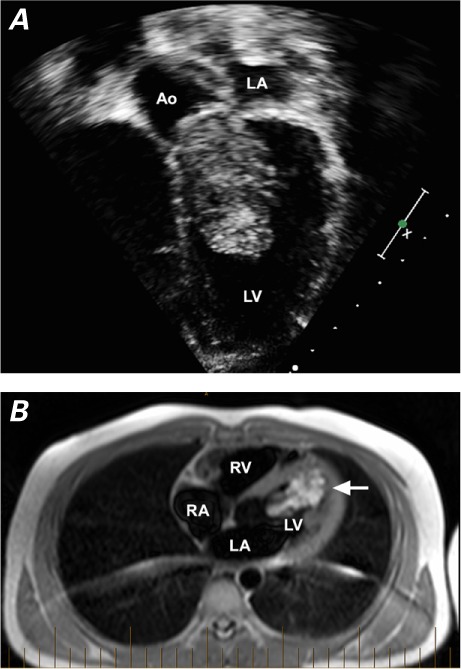
A) Two-dimensional transthoracic echocardiogram shows a 2.5 × 5-cm, lobulated echogenic mass within the left ventricular cavity, obstructing the left ventricular outflow tract. B) Cardiac magnetic resonance image shows the increased T2 signal of the mass (arrow) within the left ventricular cavity. Additional characteristics of the mass include an associated low T1 signal, irregular borders on steady-state free precession sequences, and heterogeneous enhancement on 5- and 10-minute delayed post-contrast imaging.
Ao = aorta; LA = left atrium; LV = left ventricle; RA = right atrium; RV = right ventricle