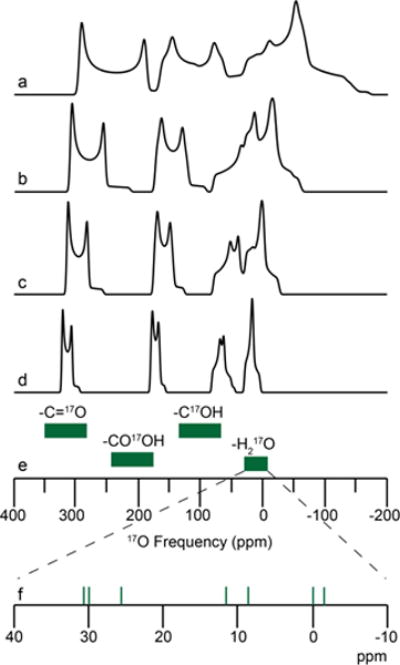
Figure 7.

17O chemical shift ranges (green, e) and MAS simulations (above) for various biologically relevant oxygen environments at (a) 11.7 T, (b) 16.4 T, (c) 21.1 T, and (d) 30.5 T (1.3 GHz 1H, in development at FBML-MIT100) using parameters for L-tyrosine • HCl for the carbonyl, carboxylic acid, and phenol oxygen environments81 and L-glycyl-glycine HCl monohydrate for the bound water environment (this work). (f) Green vertical lines are the isotropic 17O chemical shift determined within this study.
