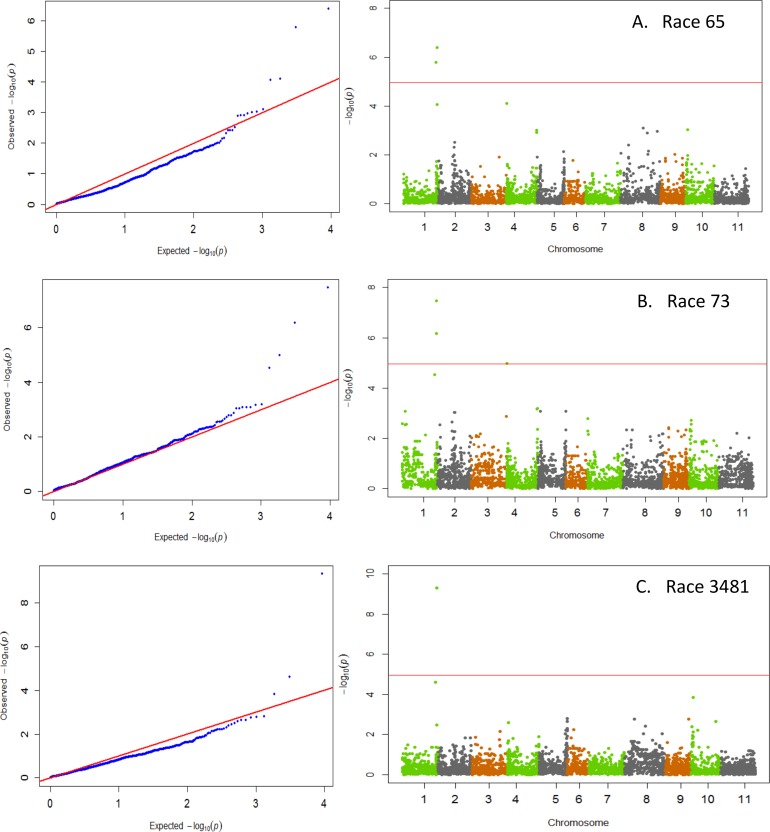
Fig 1. QQ and Manhattan Plots showing candidate SNPs and P-values from GWAS using MLM for anthracnose resistance.
From top to bottom include results for anthracnose resistance to A) race 65, B) race 73, and C) race 3481 on Pv01. Red line on Manhattan Plots is the significance threshold of P = 1.03 x 10⁻⁵ after Bonferonni correction of α = 0.05.

