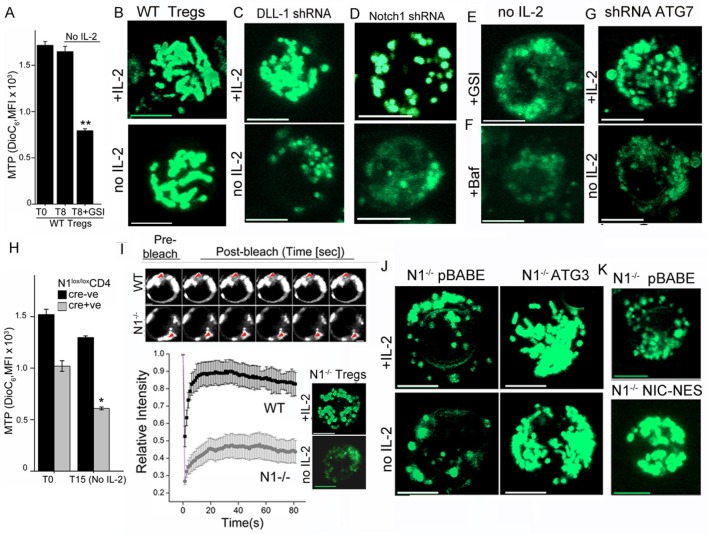
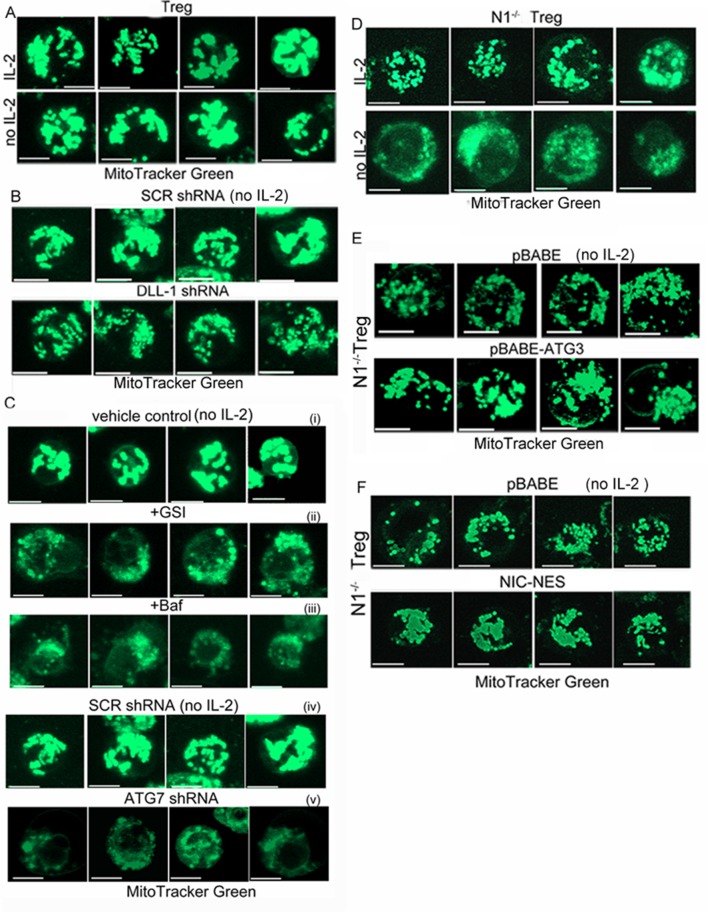
Figure 3. Notch regulates mitochondrial organization via autophagy.
(A) DiOC6 uptake in activated Tregs in the input population at onset of the assay (T0) or in cells cultured without cytokine for 8 hr with or without 10 μM GSI (Data are plotted to show Mean ± SD, p**</=0.001). (B-G) Representative confocal (Z-projected) images of mitochondria stained with MitoTracker Green in WT Tregs cultured for 6 hr in the following conditions: with or without IL-2 (B), post retroviral transfection of DLL-1 shRNA +/- IL-2 (C); or transfection of Notch1 shRNA +/- IL-2 (D); no IL-2+GSI (E) no IL-2 + Baf (F) or post retroviral transfection of shRNA to Atg7 +/- IL-2 (G). F and G, percent DiOC6-high (live) WT and Notch1-/- Tregs at T0 (F) or 15 hr after culture without IL-2 (G). Mean ± SD from 3 separate experiments. (H) DiOC6 fluorescence in activated Notch1-/- and control Notch1+/+ Tregs in the input population at the onset of the assay (T0) or in cells cultured without cytokine for 15 hr. (Mean ± SD, p*</=0.03). (I) FRAP analysis in MitoTracker Green loaded WT or Notch1-/- Tregs (n=10 cells/ cell type, scale bar 2 μm) at T0. Inset: mitochondria in Notch1-/- Tregs cultured for 6 hr with or without IL-2. (J and K) Representative confocal images (at 6 hr) of mitochondria loaded with MitoTracker Green in Notch1-/- Tregs transfected with Atg3 or empty vector (pBABE), cultured with or without IL-2 (J) or Notch1-/- Tregs transfected with NIC-NES or empty vector (pBABE) in IL-2 (K). Images are representative of n=20 cells per experimental group from 2–3 experiments, scale bar 5 μm. This figure is accompanied by Figure 3—figure supplement 1


