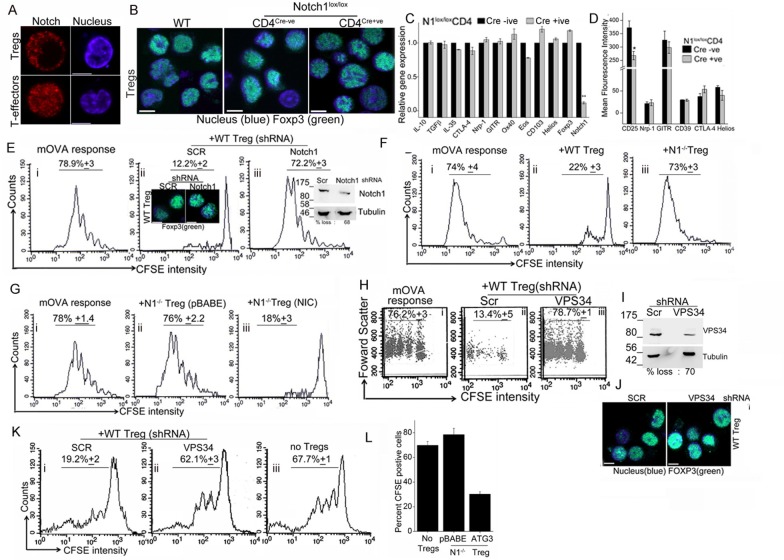
Figure 5. Notch activity and autophagy regulate Treg suppressor function.
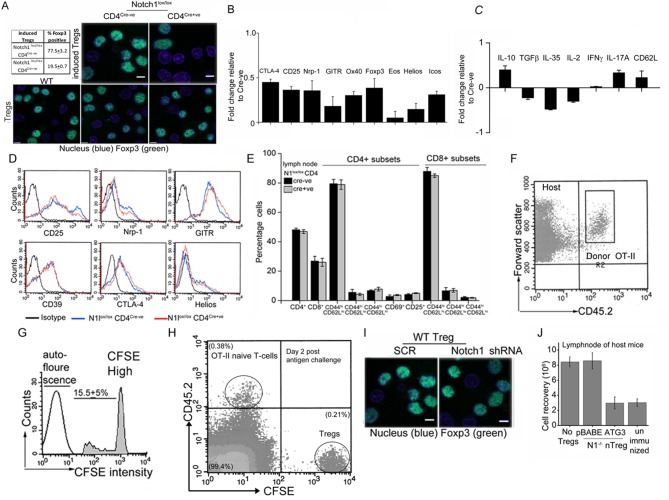
(A) Representative, confocal images (central stack) of activated Tregs (upper panel), or T-effectors (lower panel) immune-stained for NIC (red) and Hoechst 33342 (blue). N: 15–20 cells/experiment. (B) Representative confocal (central stack) field views of activated Tregs immune-stained for Foxp3 (green) and Hoechst 33342 (blue). Tregs were derived from C57Bl/6 (wildtype, WT) or Cre negative (Cre-ve) or Cd4-Cre::Notch1lox/lox (Cre+ve) mice. (C) Real Time PCR quantification of genes enriched in Tregs, comparing activated Tregs from Cd4-Cre::Notch1lox/lox (open bars) and genetic control Cre-ive (black bars) mice. 5–6 mice are included in each group being compared. The data plotted is mean+/-SD. p**</=0.001. (D) Flowcytometry based expression of molecules (mean fluorescence intensity, MFI, relative to control isotype antibody shown) enriched in Treg subsets, compared in activated Tregs generated from Cre+ive (open bars) and Cre-ive (black bars) mice. 4–6 mice are included in each group. (E) Flowcytometry plots indicating dilution of CFSE in CD45.2+ (OT-II) gated cells isolated from lymph nodes of mice injected with OT-II cells alone (i) or, OT-II co-injected with Tregs transduced with scrambled (ii) or Notch1 shRNA (iii), three days after antigen challenge. Inset: (ii) confocal images of Tregs detecting Foxp3 in scrambled or Notch1 shRNA groups and (iii) immunoblot for Notch1 in shRNA treated groups. (F) Flowcytometry plots indicating dilution of CFSE in CD45.2+ (OT-II) gated cells isolated from lymph nodes of mice injected with OT-II (i) OT-II + WT Tregs (ii) or OT-II + Notch1-/- Tegs (iii) three days after antigen challenge. (G) CFSE dilutions of OT-II cells co-injected with Notch1-/- Tregs transduced with empty vector (pBABE) (ii) or recombinant NIC (iii) three days after antigen challenge. Data are representative of 2–3 independent experiments with 2–3 mice/ experimental group. Percentage of cells in the CFSE diluted group is indicated in each plot. Tregs activated in vitro are used in all experimetns. (H) Proliferation in CD4+OT-II cells alone (i), or co-injected with Tregs transduced with retroviruses expressing shRNA to VPS34 (iii) or a scrambled control (ii) post antigen challenge. (I) Confocal (merged) images of Foxp3 (green) immunostaining counterstained with Hoechst 33342 (blue). (J) immunoblot detecting VPS34 (H) in shRNA treated groups as in H. (K) Flow cytometry plots indicating CFSE dilution in naïve CD4+T-cells 72 hr post-stimulation with anti-CD3 and APC in vitro. T-cells were either cultured alone (no Tregs) or with Tregs transduced with shRNA as described in H. (L) Percent CFSE positive, CD45.2+ OT-II cells isolated from host mice isolated after antigen challenge. Host mice were injected with OT-II naïve T-cells alone (no Tregs) or, naïve cells co-injected with Notch1-/- Tregs retrovirally transduced with empty vector pBABE or recombinant ATG3. Scale bar: 5 μm. This figure is accompanied by Figure 5—figure supplement 1.


