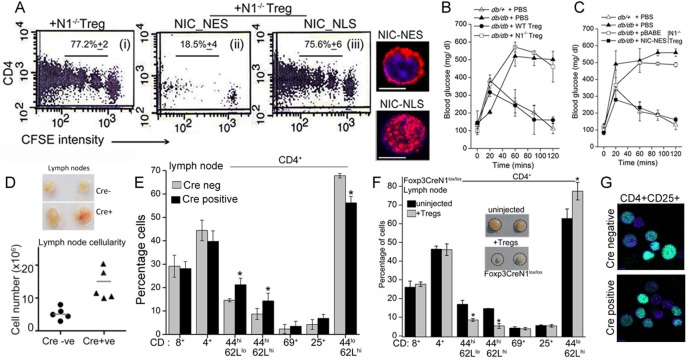
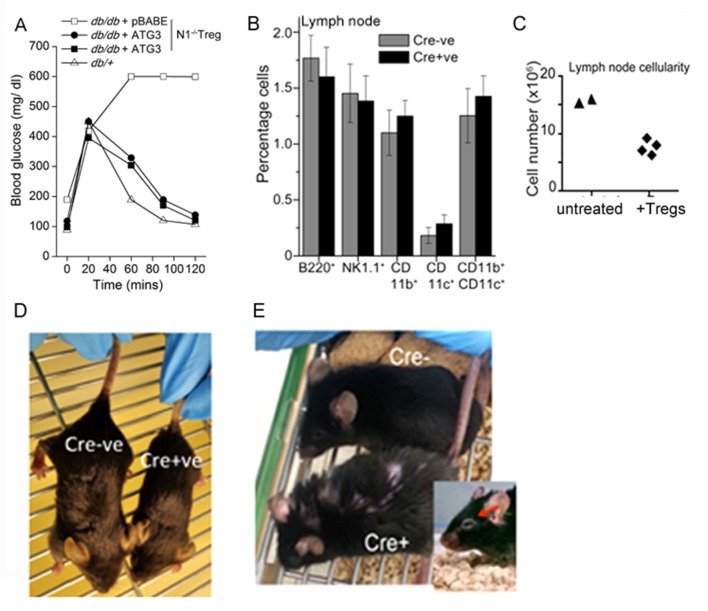
Figure 6. Non-nuclear NIC regulates Treg suppressor activity.
(A) Proliferation of CFSE loaded CD4+ OT-II cells co-injected with untransfected, or NIC-NES or NIC-NLS transfected Notch1-/- Tregs. The numbers indicate the percentage of the population with CFSE dilution Inset: staining for Notch1 in transfected cells. (B) IPGTT in Leprdb/+ (△) or Leprdb/db(filled ∆) mice injected intravenously with PBS (△ or▲), or WT (⬤) or Notch1-/- (□) Tregs. (C) IPGTT in Leprdb/+ (△) or Leprdb/db mice injected intravenously with Notch1-/- Tregs expressing recombinant NIC-NES (■) or pBABE (□). Data are mean ± SD of 2 independent experiments with three animals in each condition. (D) Whole lymph nodes (representative) from Cre+ and Cre- mice and plotted below, cell recoveries from lymph nodes from mice from different experiments. (E) T-cell immune cells subset analysis in lymph nodes isolated from wild type and mutant mice. (F) Subset analysis of T-cells in lymph-nodes of mutant mice, which are either not injected or injected with WT Tregs mice seven days prior to analysis. (G) Representative confocal images (field views) of activated Tregs from Cd4-Cre::Notch1lox/lox and Cre-ve mice fixed and stained for Foxp3 (green) and counterstained with Hoechst 33342 (nucleus, blue). *p≤0.03; Scale bar: 5 μm This figure is accompanied by Figure 6—figure supplement 1.


