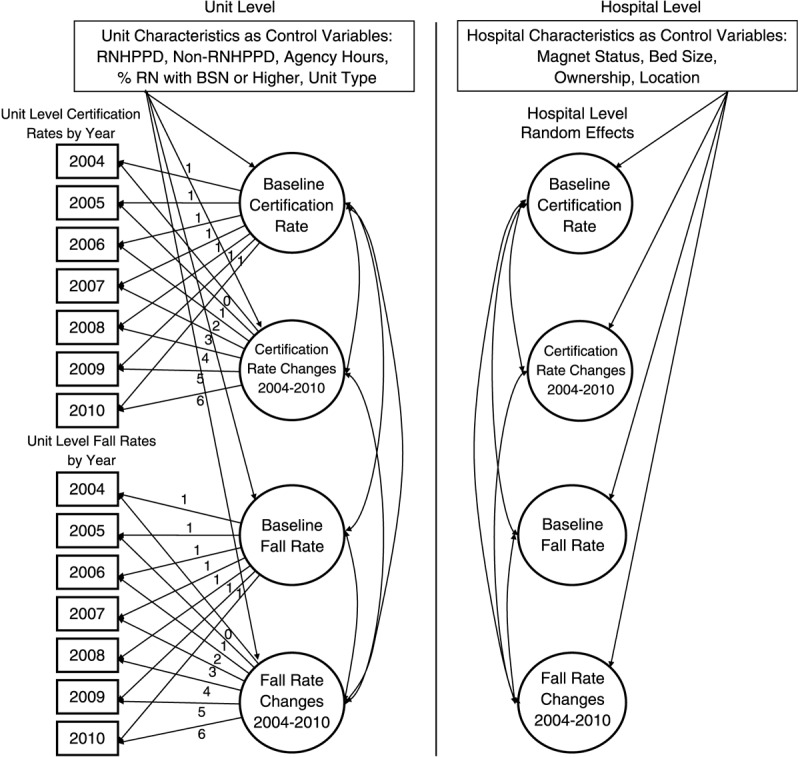
FIGURE 1.

Theoretical model of RN national nursing specialty certification rates and patient total fall rates, showing hypothesized relationships. The figure depicts a multilevel latent growth curve model, which reflects variation in baseline rates and growth over time among units (unit level) and across hospitals (hospital level). Fixing loadings as shown allows linear change models to be estimated. RNHPPD = registered nurse hours per patient day; BSN = Bachelor of Science in Nursing.
