
Figure 5.
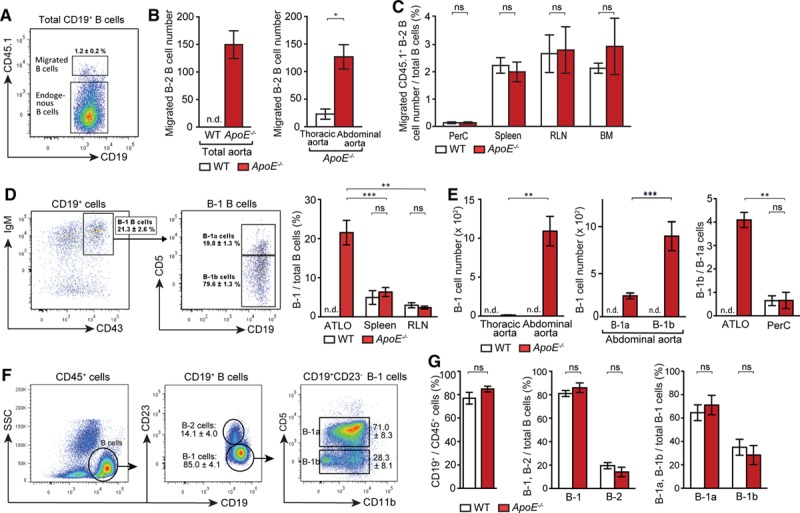
Artery tertiary lymphoid organs (ATLOs) promote B-2 B-cell recruitment into the abdominal aorta, skewing of ATLO B-1 cells toward B-1b cells. Fluorescence-activated cell sorting (FACS)–purified Ly5.1+ CD19+/CD43− B-2 cells (purity, >98%) were adoptively transferred via tail vein injection into aged wild-type (WT) or ApoE−/− mice. Thirty-six hours later, Ly5.2+ recipient mice were analyzed for B-2 cell migration into ATLOs or thoracic aorta segments. A, Migrated B-2 B cells were gated from total B cells in ATLOs. B, Quantification of migrated Ly5.1+ B-2 B cells in aorta. C, Peritoneal cavity (PerC), spleen, renal lymph nodes (RLNs), and bone marrow (BM). Results represent mean±SEM; *P<0.05, 2-sided unpaired Student t test. WT, n=3; ApoE−/−, n=3. B-1 cells selectively accumulate in ATLOs. D, IgMhi/CD43+ B-1 cells were gated from CD19+ B cells, and CD5+ B-1a and CD5− B-1b cells were gated from total B-1 cells in ATLOs and the percentage of B-1 cells from total B cells were quantified in ATLOs and SLOs. E, Absolute numbers of B-1 cells were quantified in aortic segments in WT and ApoE−/− mice. The ratio of B-1b/B-1a B cells in ATLOs compared with that in PerC of WT and ApoE−/− mice. FACS plots show the gating strategy for B-cell subpopulations in PerC (F) and their frequencies of B cells in CD45+ cells, B-1, and B-2 cells in total B cells, B-1a, and B-1b cells in B-1 cells were compared between WT and ApoE−/− mice (G). Results represent mean±SEM; **P<0.01 and ***P<0.001; 2-sided unpaired Student t test with Bonferroni–Holm correction. WT and ApoE−/−, n=5–6. n indicates the number of experiments; n.d., not detectable; ns, not significant; and SSC, side scatter.