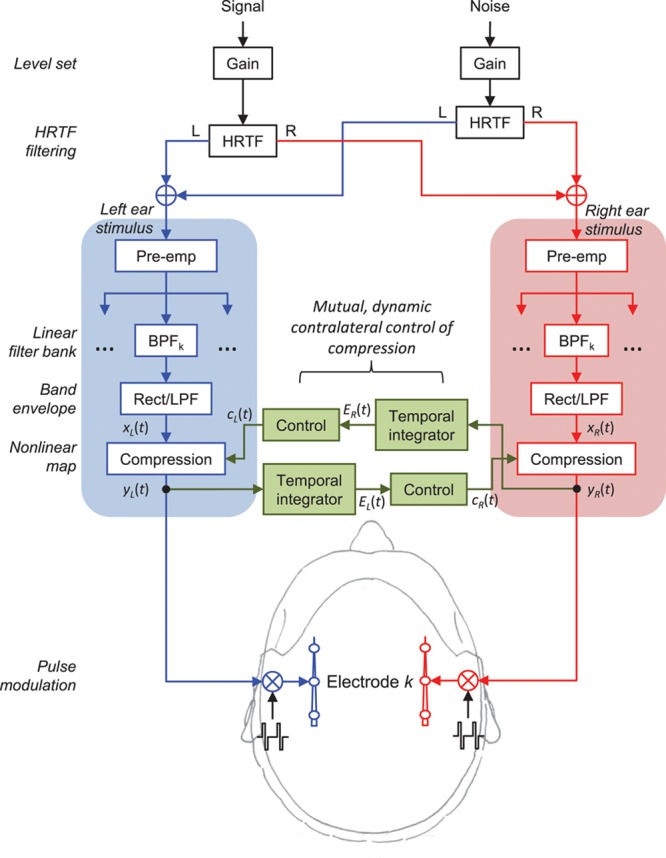
Fig. 1.

Signal processing block diagram. The diagram illustrates how the target speech and noise signals were HRTF filtered to simulate free-field stimuli at the left and right ears, and how the stimulus at each ear was processed through corresponding STD and MOC processors (processing is only shown for the kth channel). Note that STD and MOC processors were identical except that MOC processors included contralateral control of back-end compression. See text for further details. MOC indicates medial olivocochlear reflex; STD, standard strategy.
