
Fig. 3.
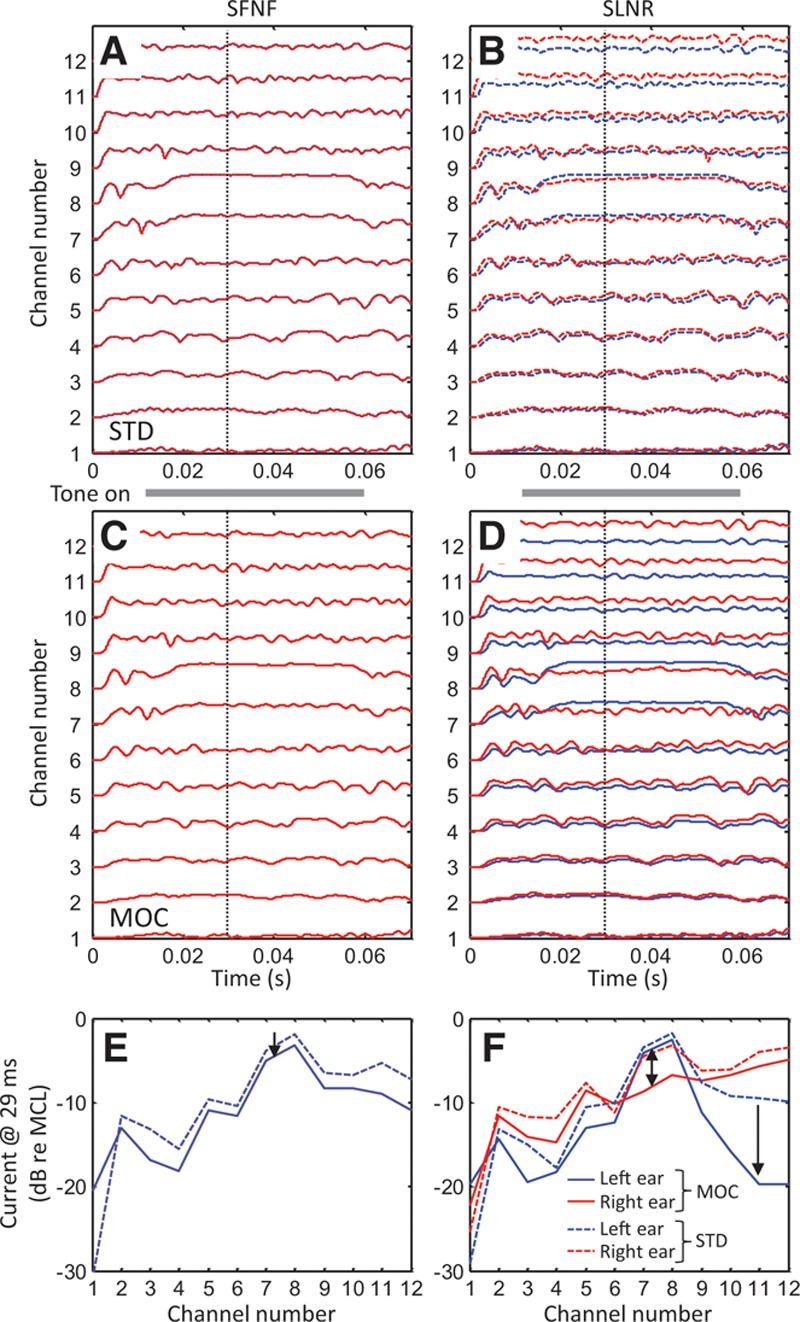
Bilateral electrical stimulation patterns generated with the STD and MOC strategies. The stimulus was a −20 dB FS, 2-kHz pure tone signal in continuous white noise at 0 dB SNR. The tone had 10-msec onset and offset ramps and was on over the time period from 10 to 60 msec, as indicated by the thick gray bar between the top two panels. Panels on the left and on the right illustrate results for the SFNF and SLNR spatial configurations, respectively. A–D, Electrical current amplitude as a function of time for each frequency channel for the STD (A, B) and the MOC (C, D) strategy. E–F, Electrical current amplitude at time 29 msec (vertical dotted lines in A–D) as a function of frequency channel number. Channels 1 and 12 are the lowest and highest in frequency, respectively. Blue and red traces illustrate results for the left and the right ears, respectively. Note the overlap between the red and blue traces in (A), (C), and (E). MOC indicates medial olivocochlear reflex; SFNF, speech front, noise front; SLNR, speech left, noise right; SNR, signal-to-noise ratio; STD, standard strategy.