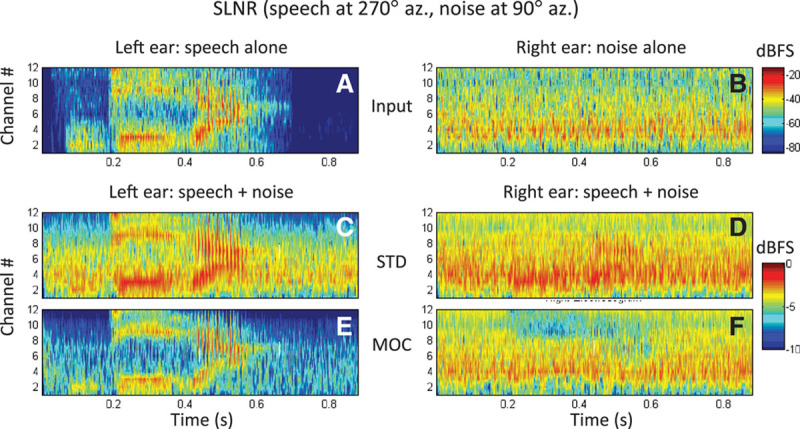
Fig. 4.

Bilateral electrodograms for the SLNR spatial configuration generated with the STD and MOC strategies. The stimulus is the Spanish word diga at −20 dB FS in speech-shaped noise at 0 dB SNR. Each panel illustrates output amplitude (color scale, in dB FS) as a function of time (abscissa) and channel number (ordinate). In all panels, output amplitudes are shown for 12 channels (with channel #1 being the lowest in frequency) but the color shading has been interpolated across channels to make the plot look like a spectrogram. A, Magnitudes at the output of the left-ear linear filter bank (Fig. 1) for the speech alone. B, Magnitudes at the output of the right-ear linear filter bank for the noise alone. Note that the plots in (A) and (B) can be thought of as acoustic spectrograms of the word and noise tokens alone at the left and right ears, respectively. C, D, Electrodograms for the left- and right-ear STD processors, respectively. E, F, Corresponding electrodograms for the left- and right-ear MOC processors, respectively. Note the different decibel range illustrated by the two color bars: the narrower range (bottom) illustrates the compressed range of output amplitudes while the broader range (top) illustrates the range of input amplitudes. FS indicates full scale; MOC, medial olivocochlear reflex; SLNR, speech left, noise right; SNR, signal-to-noise ratio; STD, standard strategy.
