
Table 1.
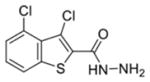
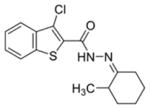
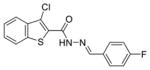
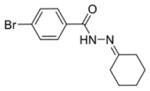
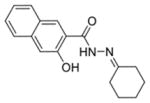
Inhibitor Structures and Ability To Inhibit Different DNA Glycosylasesa
| ID | Structure | IC50 (μM) | ||||
|---|---|---|---|---|---|---|
| gel | fluorescence | (% activity with 50 μM inhibitor) | ||||
|
| ||||||
| OGG1 | NEIL1 | NTH1 | Fpg | |||
| 08 |
|
0.22 ± 0.08 | 0.35 ± 0.05 | 84.56% | 63.09% | 91.74% |
| 0154 |
|
0.27 ± 0.15 | 0.37 ± 0.02 | 82.27% | 94.85% | 87.31% |
| 0167 |
|
0.33 ± 0.02 | 0.42 ± 0.09 | 86.69% | 89.21% | 81.69% |
| 0151 |
|
0.63 ± 0.18 | 0.61 ± 0.11 | 97.63% | 84.47% | 91.70% |
| 0158 |
|
0.34 ± 0.04 | 0.29 ± 0.02 | 87.42% | 83.02% | 77.02% |
| Isoniazid (INH) |
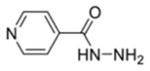
|
>50 | >50 | 80.64% | 97.95% | ND |
a
The first column contains the five most potent OGG1 inhibitors identified by our screen and one non-inhibitor (isoniazid, INH) with corresponding structures. The second column denotes the mean IC50 values from three independent experiments for the gel-based or fluorescence-based OGG1 assays. The uncertainties are standard deviations. The third column indicates the percent activity of NEIL1, NTH1, or Fpg in the presence of 50 μM inhibitor compared with the no inhibitor control.
ND = not determined.