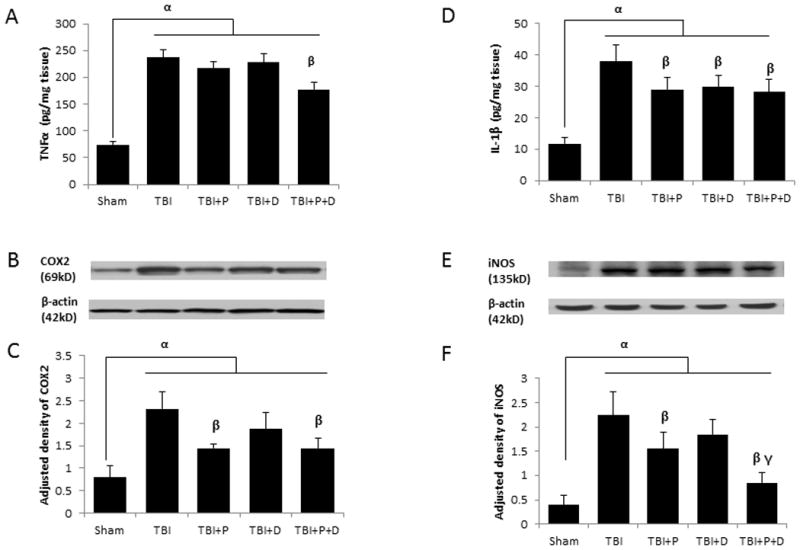
Figure 4.

The effect of treatments on the expression of inflammatory factors at 24 h after TBI. A. TNFα expression shown by ELISA. B. Representative bands of COX2 shown by western blot. C. Adjusted density of COX2. D. IL-1β expression assessed by ELISA. E. Representative bands of iNOS shown by western blot. F. Adjusted density of iNOS. n=5, α: p < 0.05 vs. Sham; β: p < 0.05 vs. TBI; γ: p < 0.05 vs. TBI+P and TBI+D. Sham: sham with vehicle treatment group; TBI: TBI with vehicle treatment group; TBI+P: TBI with progesterone treatment group; TBI+D: TBI with vitamin D treatment group; TBI+P+D: TBI with progesterone and vitamin D combination treatment group, n=5.
