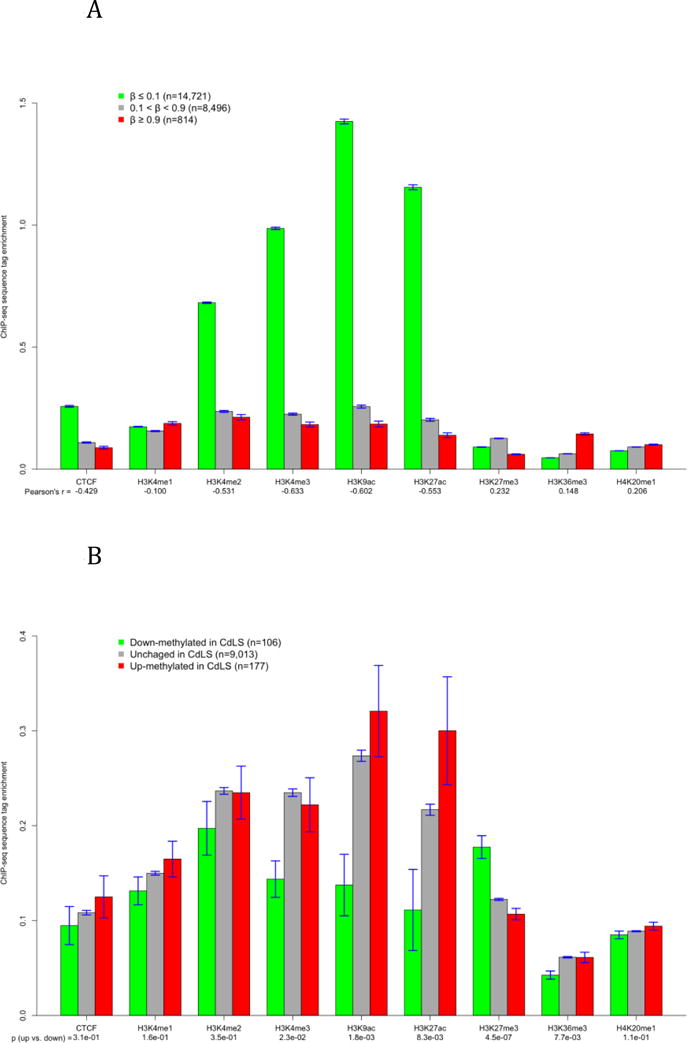
Figure 3.

The association between DNA methylation and histone modifications. The y-axis represents the average tag enrichment based on ChIP-seq data. A) The correlation of average methylation to CTCF binding and eight histone marks in GM12878 at all autosomal CpG sites. B) Histone status at CpG sites that were down-methylated, unchanged, and up-methylated in severe patients. The unchanged group include only sites with medium methylation (0.1 < β < 0.9). The p values are results of Student’s t test comparing the down- and up-methylated sites.
