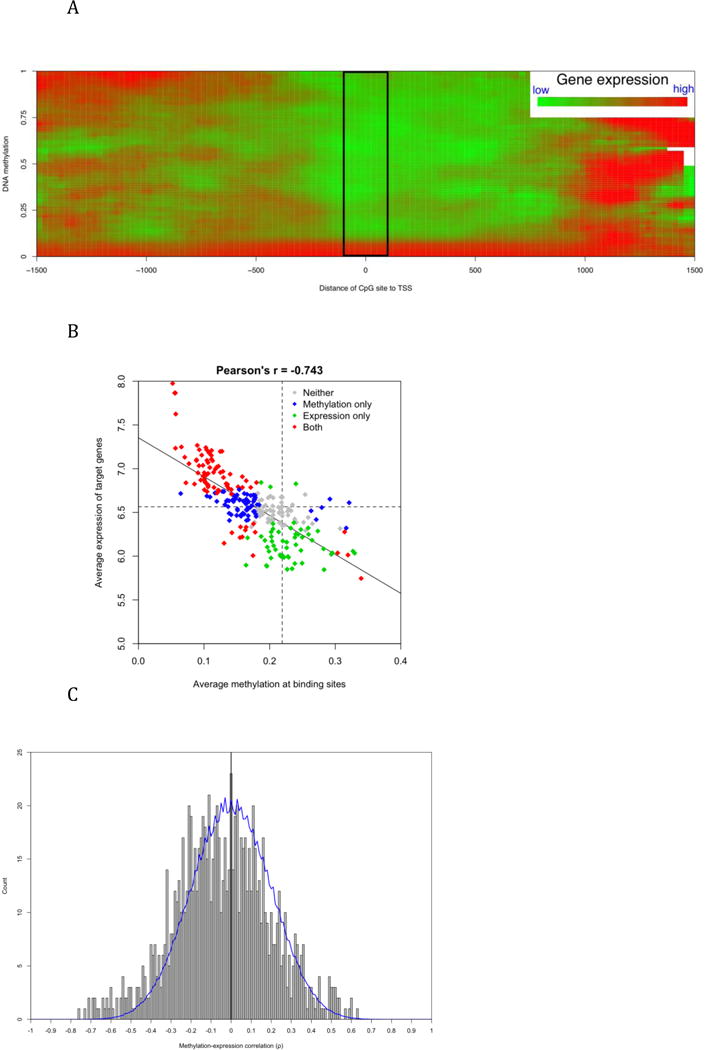
Figure 4.

The association between DNA methylation around TSS and downstream gene transcription. A) The distance of the CpG sites to TSS affected the methylation-transcription association based on 19,615 CpG-transcript pairs. Color indicates average transcription level after local smoothing. The black box shows a distinctive pattern of negative correlation when the CpG sites are located within [−100, 100] around TSSs. B) The linearly correlated methylation around TFBS and expression of target genes. Each diamond corresponds to one of 258 TFBS motifs. X-axis represents the average methylation of CpG sites within [−250, 250] around TFBS and y-axis represents average expression of genes with at least one TFBS within [−1500, 1500] of their TSS. Color indicates whether the averages are significantly (p < 0.01) different from the global average. More details are available in Supplemental Table 1. C) The distribution of Spearman’s ρ values of CpG-gene pairs. All pairs include CpG site and gene both having high variance across 27 common samples. Blue line indicates the background distribution generated by 1,000 re-sampling permutations. Among a total of 1,006 pairs, 568 (56.5%) have negative ρ values.
