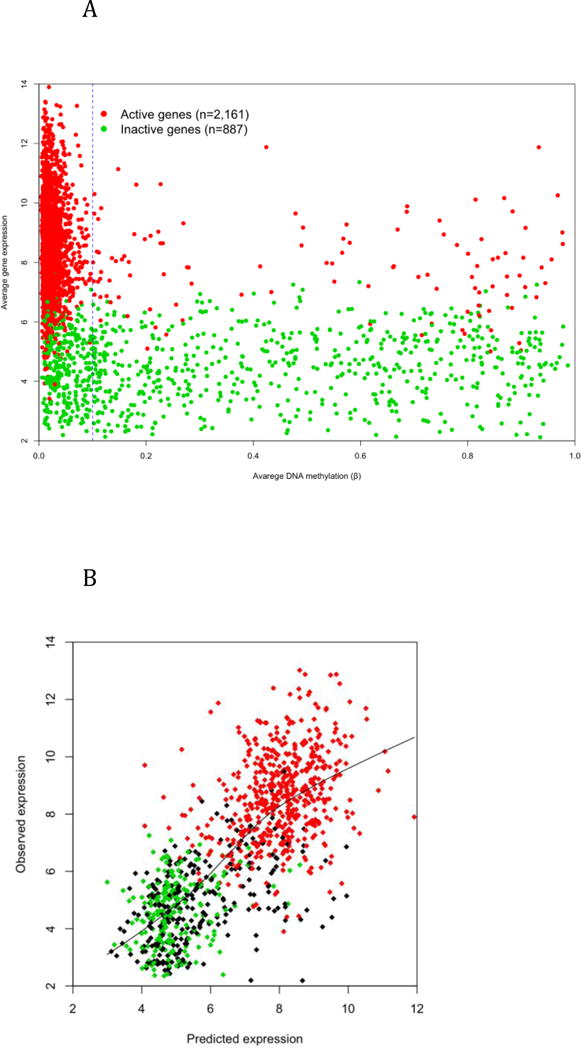
Figure 5. The prediction of gene expression using epigenetic information.

A) The average DNA methylation at TSS and 5′-UTR and the average expression of autosomal genes that are active (red) or inactive (green) in all samples. X chromosome genes are plotted separately in Supplemental Figure 12. B) Predicted vs. observed expression level of 1,000 testing genes (green: inactive, red: active; black partially active). The prediction is based on a linear regression model trained with DNA methylation, cohesin, CTCF and histone modification data of 3,100 genes.
