
Figure 5.
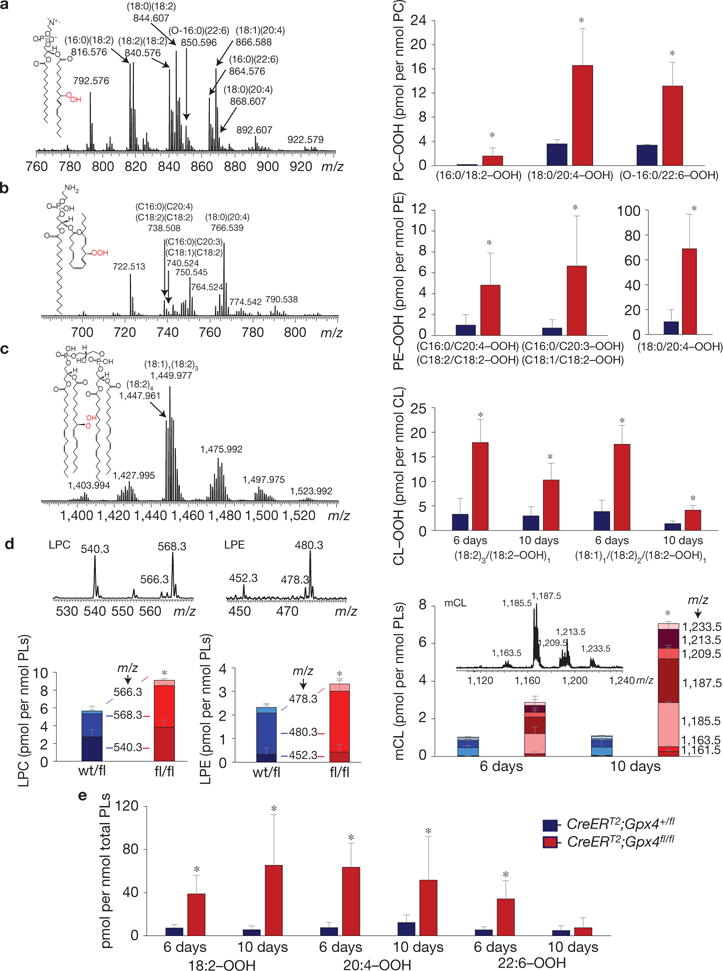
LC–MS characterization of phospholipids and their oxidation products in kidneys of Gpx4-null and wild-type mice. (a) Mass spectrum of PC obtained from kidneys of Gpx4-null mice (left panel) and the levels of hydroperoxy-PC species in Gpx4-null (CreERT2;Gpx4fl/fl) and wild-type (CreERT2;Gpx4+/fl) mice (right panel). Hydroperoxy-PC species (m/z 848.575, 872.575, 876.606, 882.595, 896.575, 898.587 and 900.606) originated from PC species with m/z 816.576 (16:0/18:2), 840.576 (18:2/18:2), 844.607 (18:0/18:2), 850.596 (O-16:0/22:6), 864.576 (16:0/22:6), 866.588 (18:1/20:4) and 868.607 (18:0/20:4). Inset: structural formula of PC–OOH—(16:0/18:2–OOH). (b) Mass spectrum of PE obtained from kidney of Gpx4−/− mice and the content of hydroperoxy-PE species in Gpx4-null mice (right panel). Oxygenated species (m/z 770.507 and 772.522 and m/z 798.538) originated from major PE molecular species with m/z 738.508 (18:2/18:2 or 16:0/20:4), 740.524 (18:1/18:2 or 16:0/20:3) and 766.539 (18:0/20:4). Inset: structural formula of PE–OOH containing hydroperoxy-arachidonic acid—(18:0/20:4–OOH). (c) Mass spectrum of CL obtained from kidney of Gpx4−/− mice (left panel) and levels of hydroperoxy-CLs (m/z 1,479.932 and m/z 1,481.975) originating from species with m/z 1,447.961 (18:2)4 and 1,449.977 18:1/(18:2)3, respectively (right panel). Inset: structural formula of CL–OOH containing hydroperoxy-linoleic acid—(18:2)3/18:2–OOH. (d) Mass spectra and levels of lysophospholipids in samples from mouse kidneys. LPC, lysophosphatidylcholine; LPE, lysophosphatidylethanolamine; mCL, mono-lysocardiolipin. (e) Content of hydroperoxy-derivatives of linoleic (18:2–OOH), arachidonic (20:4–OOH) and docosahexaenoic (22:6–OOH) acids in samples from mouse kidneys. Mass spectra of PC, PE and CL were acquired using a QExactive orbitrap mass spectrometer (ThermoFisher Scientific). The resolution was set up at 140,000 corresponding to 5 ppm deviation in m/z measurement. Mass spectra of LPC, LPE and mCL were acquired by an LXQ ion trap mass spectrometer (ThermoFisher Scientific). Consequently, m/z values are presented to three and one decimal places, respectively. PC molecular ions were detected in a negative ionization mode as acetate adducts [M–H+CH3COOH]−. LPC molecular ions were detected in a negative ionization mode as formate adducts [M–H+HCOOH]−. PE and CL as well as LPE and mCL molecular ions were detected in a negative ionization mode as singly charged ions [M–H]−. Data for hydroperoxy-species are presented as picomoles per nanomole of the parental non-oxidized species. Data shown represent the mean ± s.d. of n = 4 animals of a representative experiment performed independently two times, P =0.05 (one-way ANOVA).