
Fig. 3.
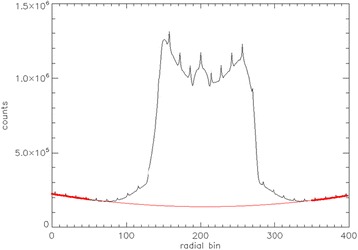
Radial net true sinogram profiles (all angles added) of a NEMA image quality phantom, filled with water solutions of 124I. A second-order polynomial is used to fit the background: the 124I profile (black line), the second-order polynomial fit (red line), and the tail region used for the fit (thick red dotted line) are shown. The phantom was scanned on a Siemens mCT PET/CT scanner