Fig. 1.

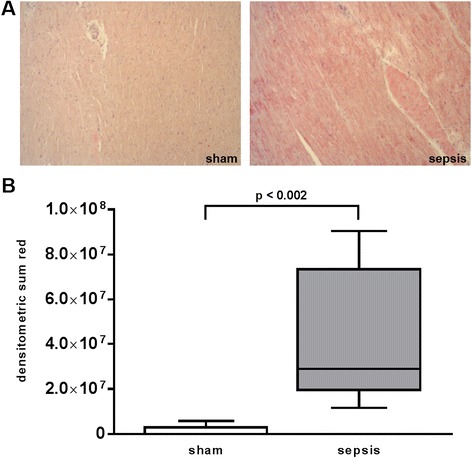
Nitrotyrosine staining of heart specimen collected at the end of the experiment after 24 h. a Two representative histological images of sham (left) and septic (right) animals (×10 magnification). b Quantitative results of densitometric analysis. Data are presented as median (range). Sham n = 5, sepsis n = 8 animals
