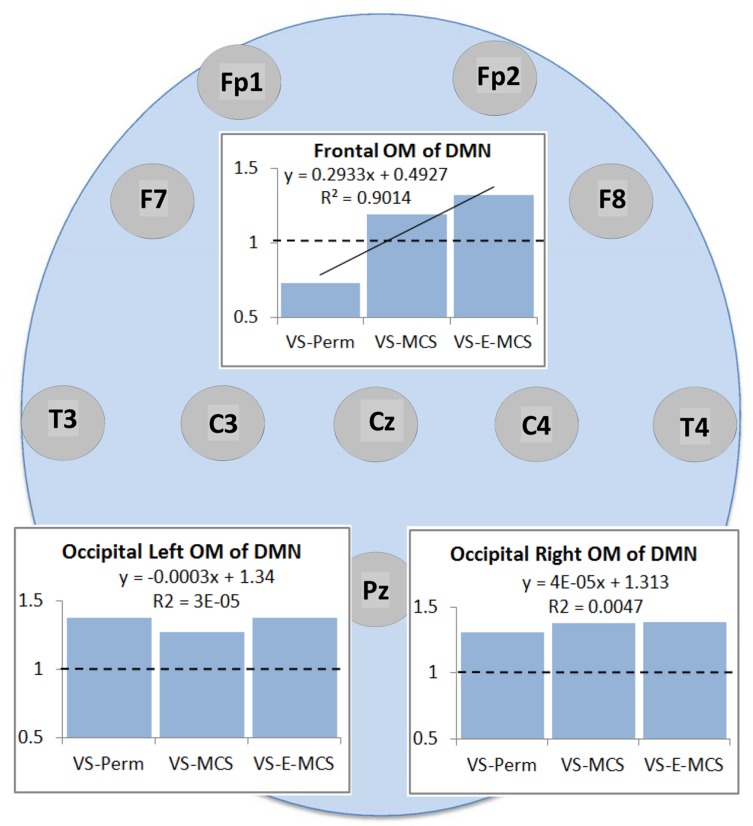
Fig. (2).
Operational synchrony strength within three OMs of the brain DMN in VS/UWS patients as a function of future (up to 6 years post-injury) stable clinical outcome: Linear regression analysis. Data in graphs are averaged across corresponding EEG channels that constitute each of the DMN OMs and all 1-minute EEGs for each state. The Y-axis presents values of strength of operational synchrony. Horizontal dotted lines in the graphs represent the upper stochastic level of connectivity. Below this threshold any connectivity is random. Solid line in the upper graph represents the linear regression equation and R2. Circles indicate the EEG electrode locations (some locations are hidden behind the graphs representing the OMs, refer to Fig. (1)). Abbreviations: OM: operational module; DMN: default mode network; VS/UWS: vegetative state / unresponsive wakefulness syndrome; EEG: electroencephalogram; VS-Pers: patient continues to be in persistent vegetative state; VS-MCS: patient continues to be in minimally conscious state; VS-E-MCS: patient emerges from minimally conscious state.

