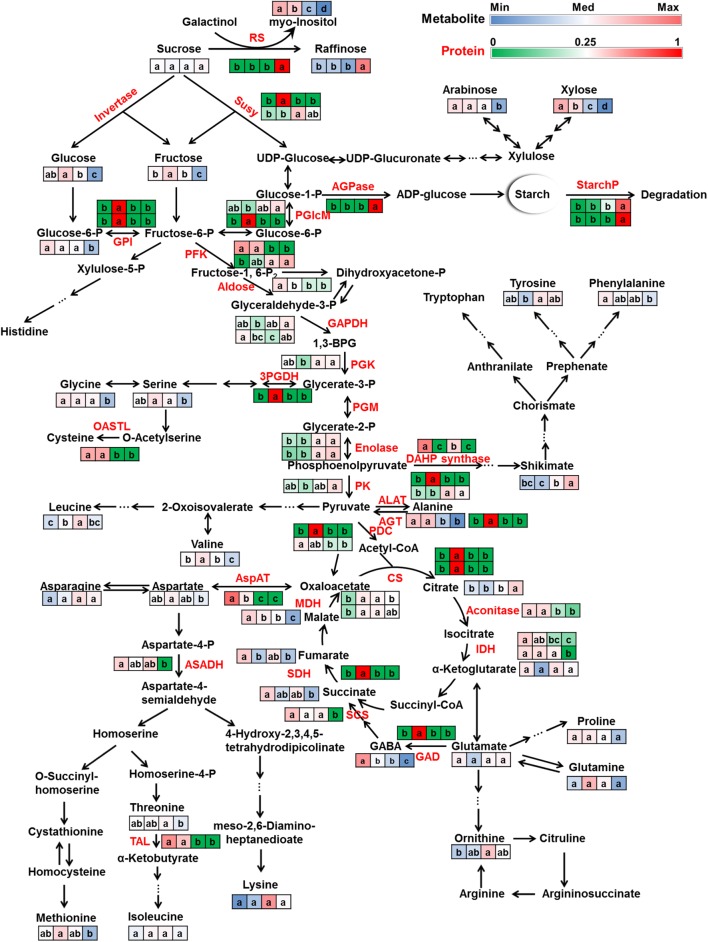
FIGURE 6.
Primary metabolism dynamics during lotus seed development. Metabolites (black) and proteins (red) involved in sugar metabolism, glycolysis, TCA cycle and amino acid metabolism were mapped on their metabolism pathways. The relative ratios of normalized metabolite peak areas were colored with blue-white-red color bar corresponding to the values from the minimum (Min) to median (Med) to maximum (Max). The relative ratios of the protein NSAFs were colored with green-white-red color bar corresponding to the ratios from 0 to 0.25 to 1. All the protein candidates that annotated as the same enzyme were list here in consecutive rows. Four squares from left to right indicate samples of 10, 15, 20, and 25 DAP, respectively. Lowercase characters in the squares indicate significant levels according to Duncan’s test (p < 0.05). Abbreviations: RS, raffinose synthase; Susy, sucrose synthase; AGPase, ADP glucose pyrophosphorylase; StarchP, starch phosphorylase; PGlcM, phosphoglucomutase (plastid); GPI, glucose-6-phosphate isomerase (plastid); PFK, phosphofructokinase; GAPDH, glyceraldehyde 3-phosphate dehydrogenase; 1,3-BPG, 1,3-Bisphosphoglyceric acid; PGK, 3-phosphoglycerate kinase; PGM, phosphoglycerate mutase; PK, pyruvate kinase; PDC, pyruvate dehydrogenase complex; CS, citrate synthase; IDH, isocitrate dehydrogenase; SCS, succinyl coenzyme A synthetase; SDH, succinate dehydrogenase; MDH, malate dehydrogenase; GAD, glutamic acid decarboxylase; GABA, 4-aminobutanoic acid (γ-Aminobutyric acid); AspAT, aspartate aminotransferase; ALAT, alanine aminotransferase; AGT, alanine-glyoxylate aminotransferase; ASADH, aspartate semialdehyde dehydrogenase; TAL, threonine ammonia-lyase; 3PGDH, 3-phosphoglycerate dehydrogenase; OASTL, O-acetylserine(thiol)lyase; DAHP synthase, 3-deoxy-D-arabino-heptulosonate 7-phosphate synthase.

