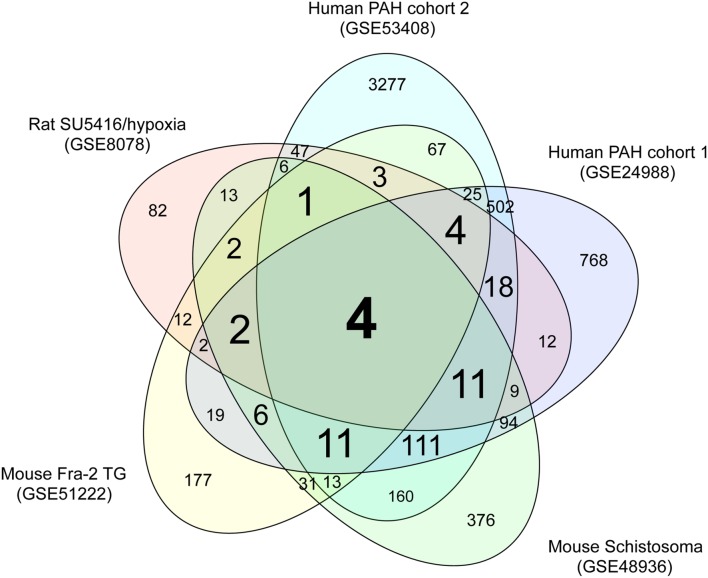
FIGURE 1.
Venn diagram of DEGs in the five PAH transcriptome datasets. Transcriptome data from a rat PAH model caused by treatment with the VEGFR inhibitor SU5416 and hypoxia (GSE8078); a mouse PAH model caused by overexpression of Fra-2, a causative gene for systemic sclerosis (GSE51222); a mouse PAH model caused by schistosomiasis (GSE48936); and two cohorts of human PAH patients (GSE24988 and GSE53408) were downloaded from a public database (GEO). Genes that were differentially expressed in the PAH and control groups of each dataset were identified as described in the methods. The numbers of DEGss unique to each transcriptome dataset and shared between datasets are shown.

