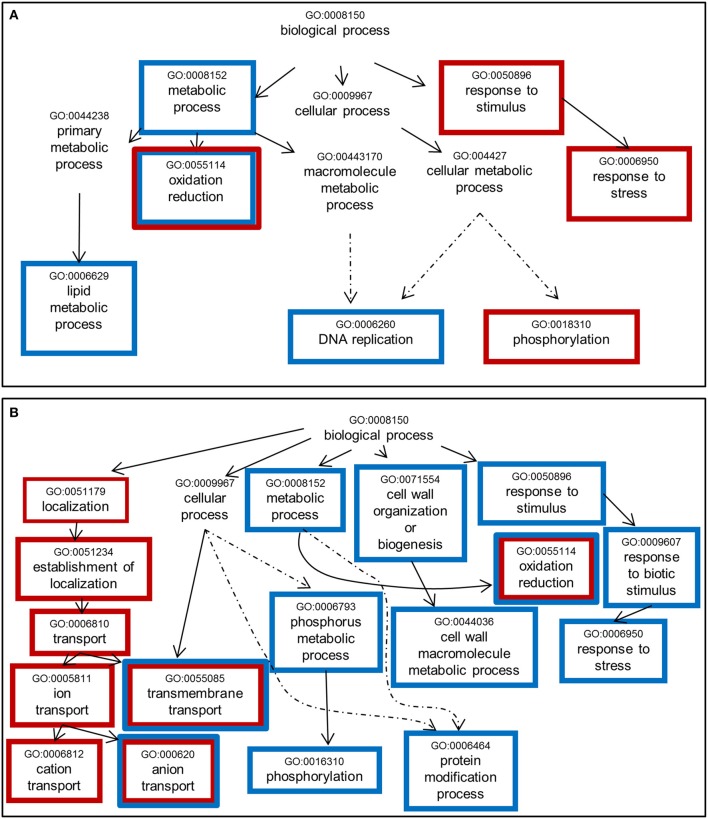
Figure 5.
Significantly enriched GO terms among genes whose expression is sensitive to Nod factor treatment. (A) Up-regulated genes. (B) Down-regulated genes. One thousand seventy genes were annotated using agriGO toolkit (http://bioinfo.cau.edu.cn/agriGO/index.php). GO terms identified with an adjusted p < 0.05 are enclosed into boxes. Red and blue boxes refer to the changes in expression levels induced by the NF 4 h and NF 20 h treatments, respectively. Dashed arrow indicates that all the GO levels have not been represented.

