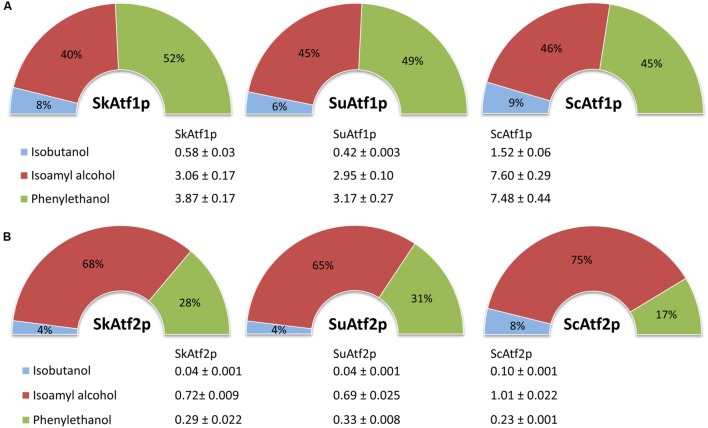
FIGURE 5.
The relative alcohol acetyltransferase activities of the Atf1 (A) and Atf2 (B) enzymes expressed as a percentage distributed among the total enzymatic activity of the measured substrates. The presented values [nmol⋅min-1(mg protein)-1] are averages and mean deviations of three replicates. The activities of the different Atf1 and Atf2 enzymes were measured in the cell extracts of the S. cerevisiae strain with atf1 atf2 iah1 deletion at a concentration of 60 mM for isobutanol, 100 mM for isoamyl alcohol and 30 mM for 2-phenylethanol.

