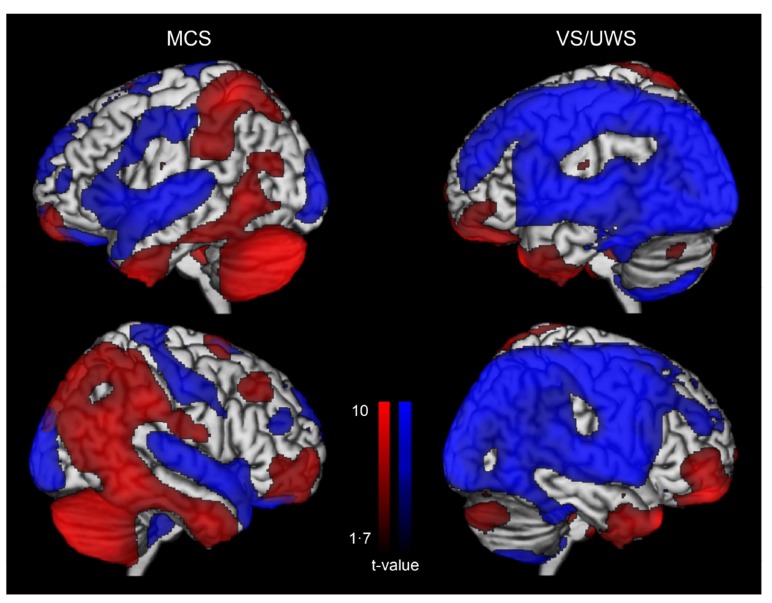
Fig. (3).
Glucose metabolism at rest in minimally conscious state (MCS) and in unresponsive wakefulness syndrome (VS/UWS). Blue represents areas with low metabolism and red represents areas with preserved metabolism when compared to healthy participants. Adapted from [27].

