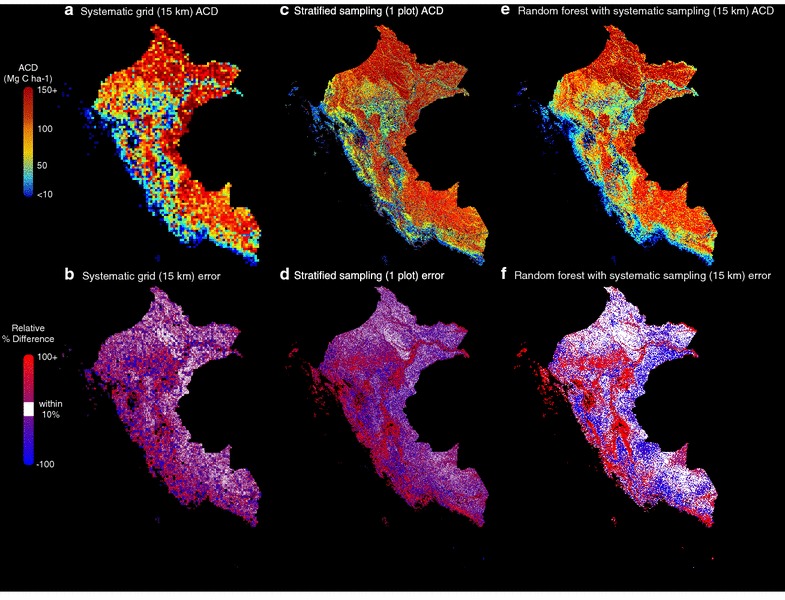
Fig. 3.

Results of the sampling and upscaling. a Estimated ACD using a 15 km systematic grid sampling approach, b percent relative difference between model ACD (from Fig. 1a) and a, c ACD using a 1-plot stratified sampling approach, d percent relative difference between model ACD and c, e ACD using random forest upscaling trained with 15 km systematic sampling grid and f percent relative difference between model ACD and (e)
