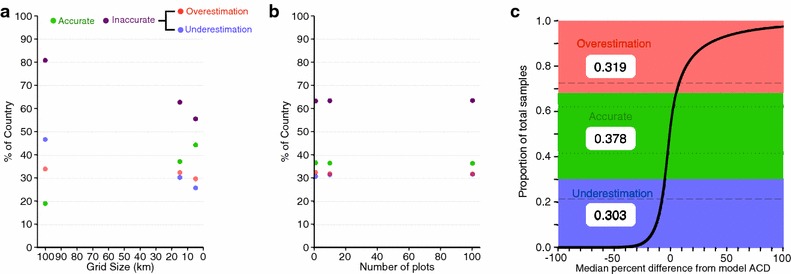
Fig. 5.

Accuracy assessment of plot sampling when using model-linked (random forest) upscaling to within at least 10 % of the model ACD using a systematic grid sampling and b stratified random sampling with same legend as in (a). The empirical cumulative distribution of the percent relative difference between the model ACD and the median estimated ACD error across c all systematic sampling grids and all stratified random sampling plot sets (see ‘‘Methods’’ section). The coloring in c show the proportions that overestimate (red), underestimate (blue), and correctly estimate (green) within 10 % of the model ACD value, and horizontal broken lines show how the proportion correctly estimated would change with a more stringent (5 %, dotted lines) or less stringent (15 %, dashed line) error threshold
