Fig. 6.

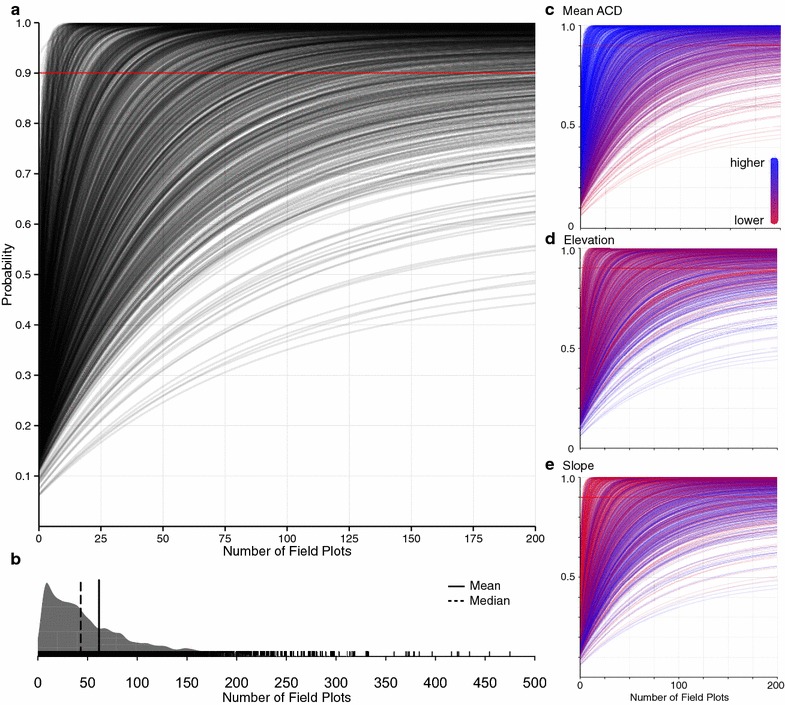
Results of the uncertainty simulations. a Number of field plots needed to reliably (pr=0.9, red line) estimate the mean ACD (Mg C ha−1) of a substratum using quintile binning (note: a random selection of 1000 substrata are plotted for clarity). b Frequency distribution of the number of field plots needed to reliably estimate a substratum’s mean ACD. Same as in a but colored by the substratum’s c mean ACD, d elevation and e slope. Further topographic and climatic variables are shown in Additional file 1: Fig. S3
