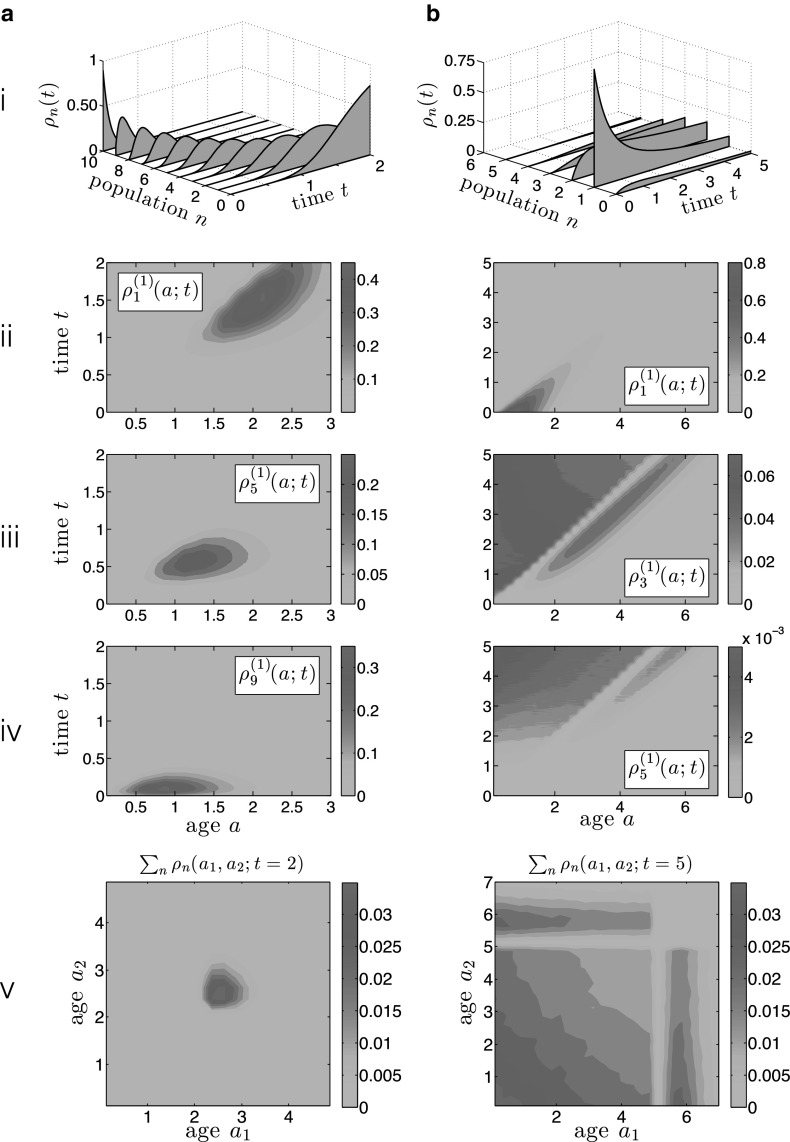
Fig. 3.
Monte–Carlo simulations of densities in age- and number-dependent birth-death processes. Column a shows results for a death-only process with a linear death rate function . We initiated all simulations from 10 individuals with initial age drawn from distribution . In column b, we consider a budding-only birth process with a carrying capacity (in Eq. 10). Here, simulations were initiated with a single parent individual with an initial age also drawn from the distribution P(a). In (i), we plot the total number density for both processes. We also plot the single-particle density function for the pure death process in a(ii–iv) and for the limited budding process in b(ii–iv). Finally, the population-summed two-point correlations functions for pure death and pure budding are shown in panels a(v) and b(v)

